In 2017-18, students receiving special education services accounted for about one in five of Vermont's chronically absent students. By 2023-24, the ratio was one in four. That shift (from 20.4% to 25.4% of the chronically absent population) happened while the overall numbers surged and then retreated. But the share for students in special education kept rising through the cycle, because their recovery has been the slowest of any major subgroup.
The growing share
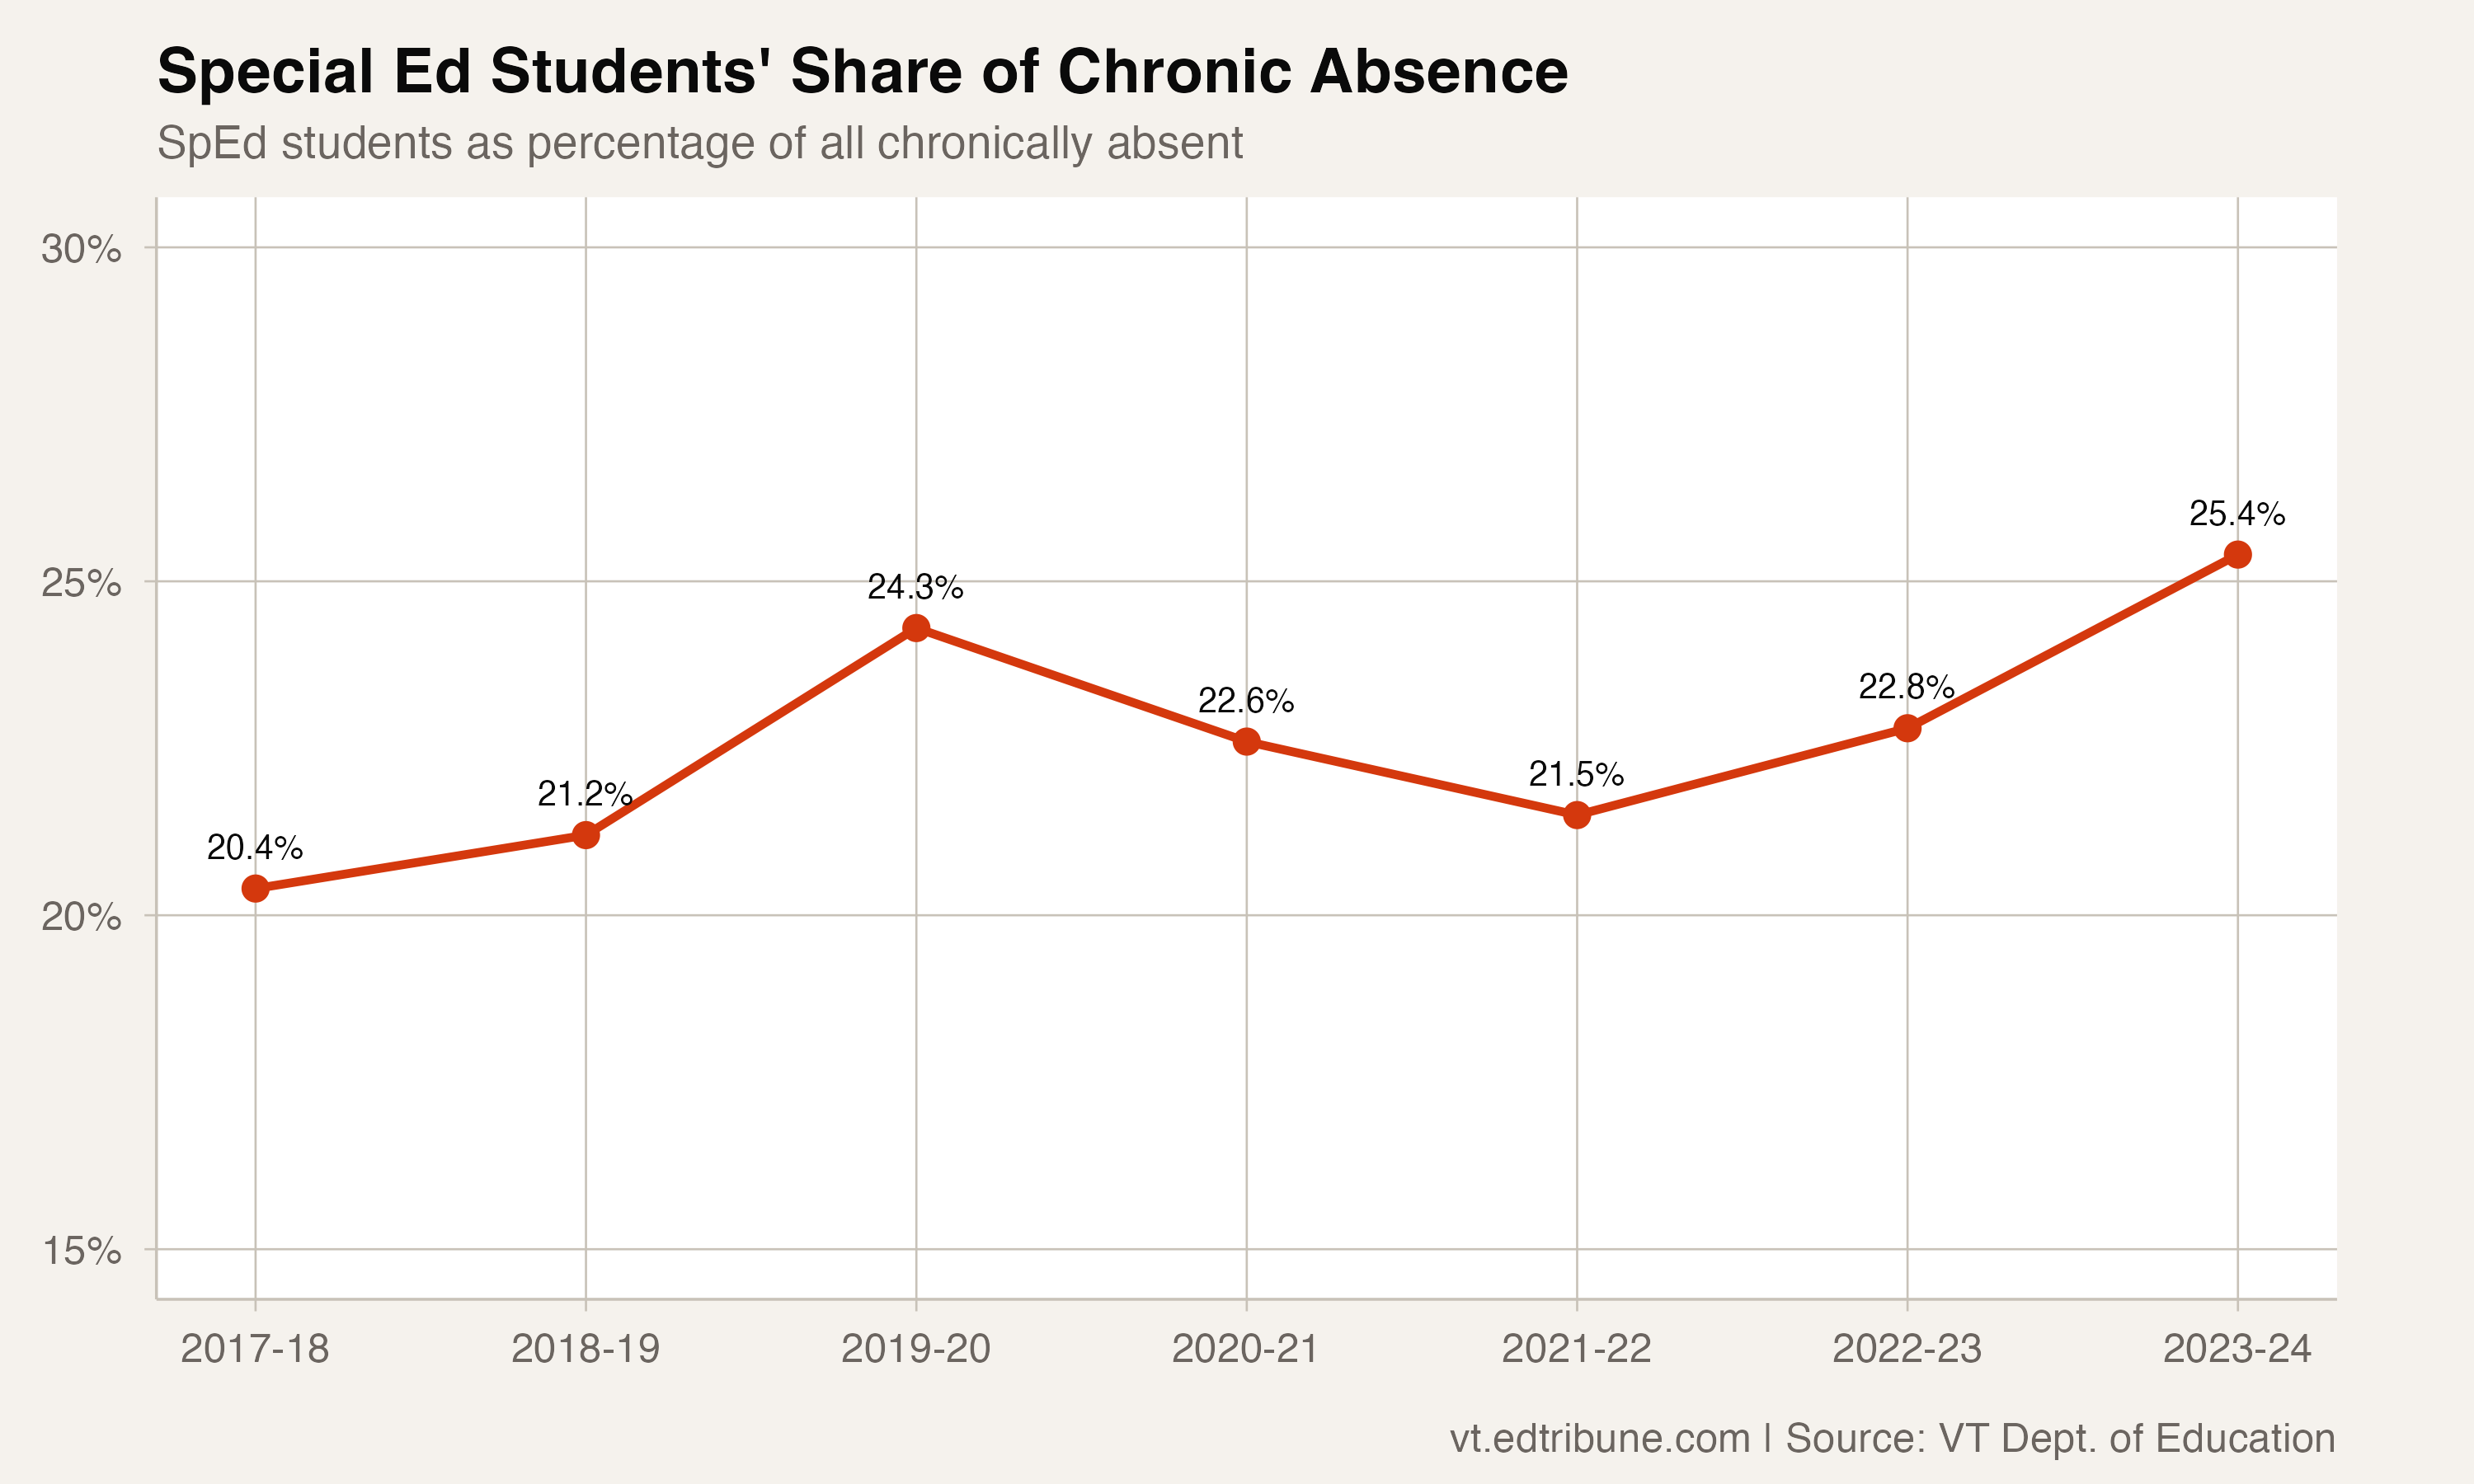
The trajectory is steady rather than dramatic. Students receiving special education services were 20.4% of the chronically absent in 2018, 21.2% in 2019, 24.3% in 2020, and have hovered between 21.5% and 25.4% since. The share dipped during the pandemic peak, not because students in special education improved, but because the non-special-education population surged so dramatically that it diluted the ratio.
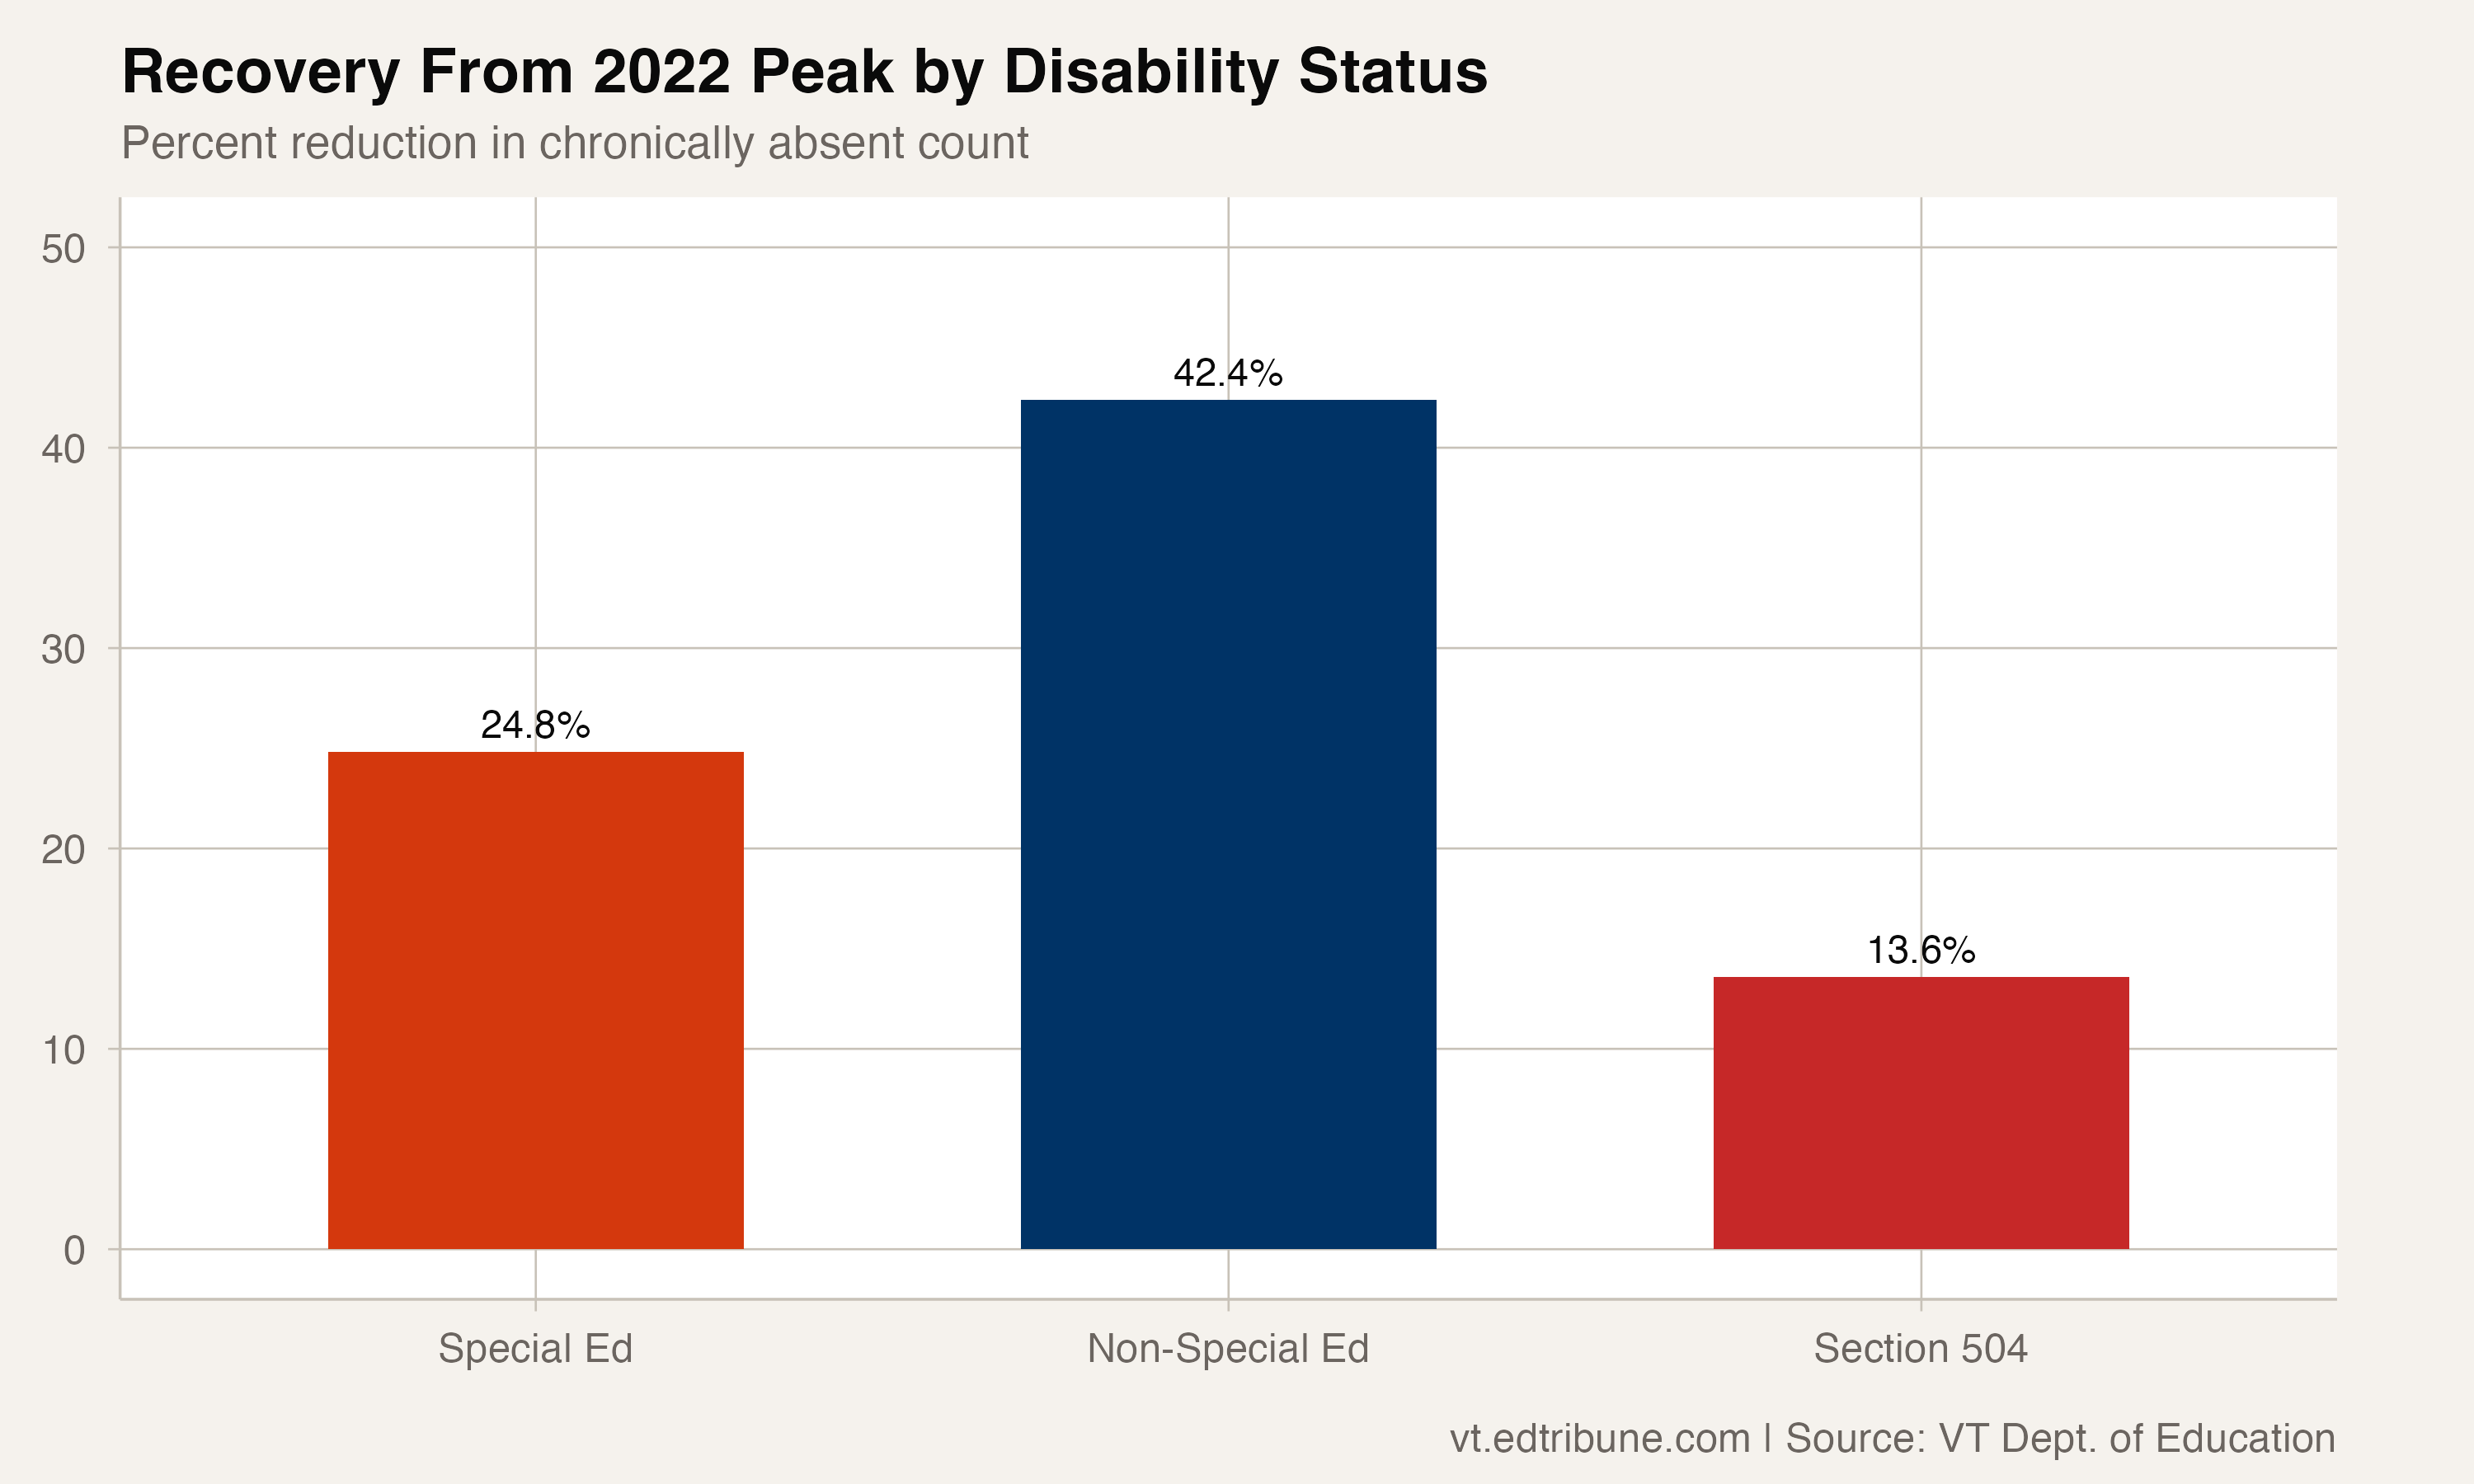
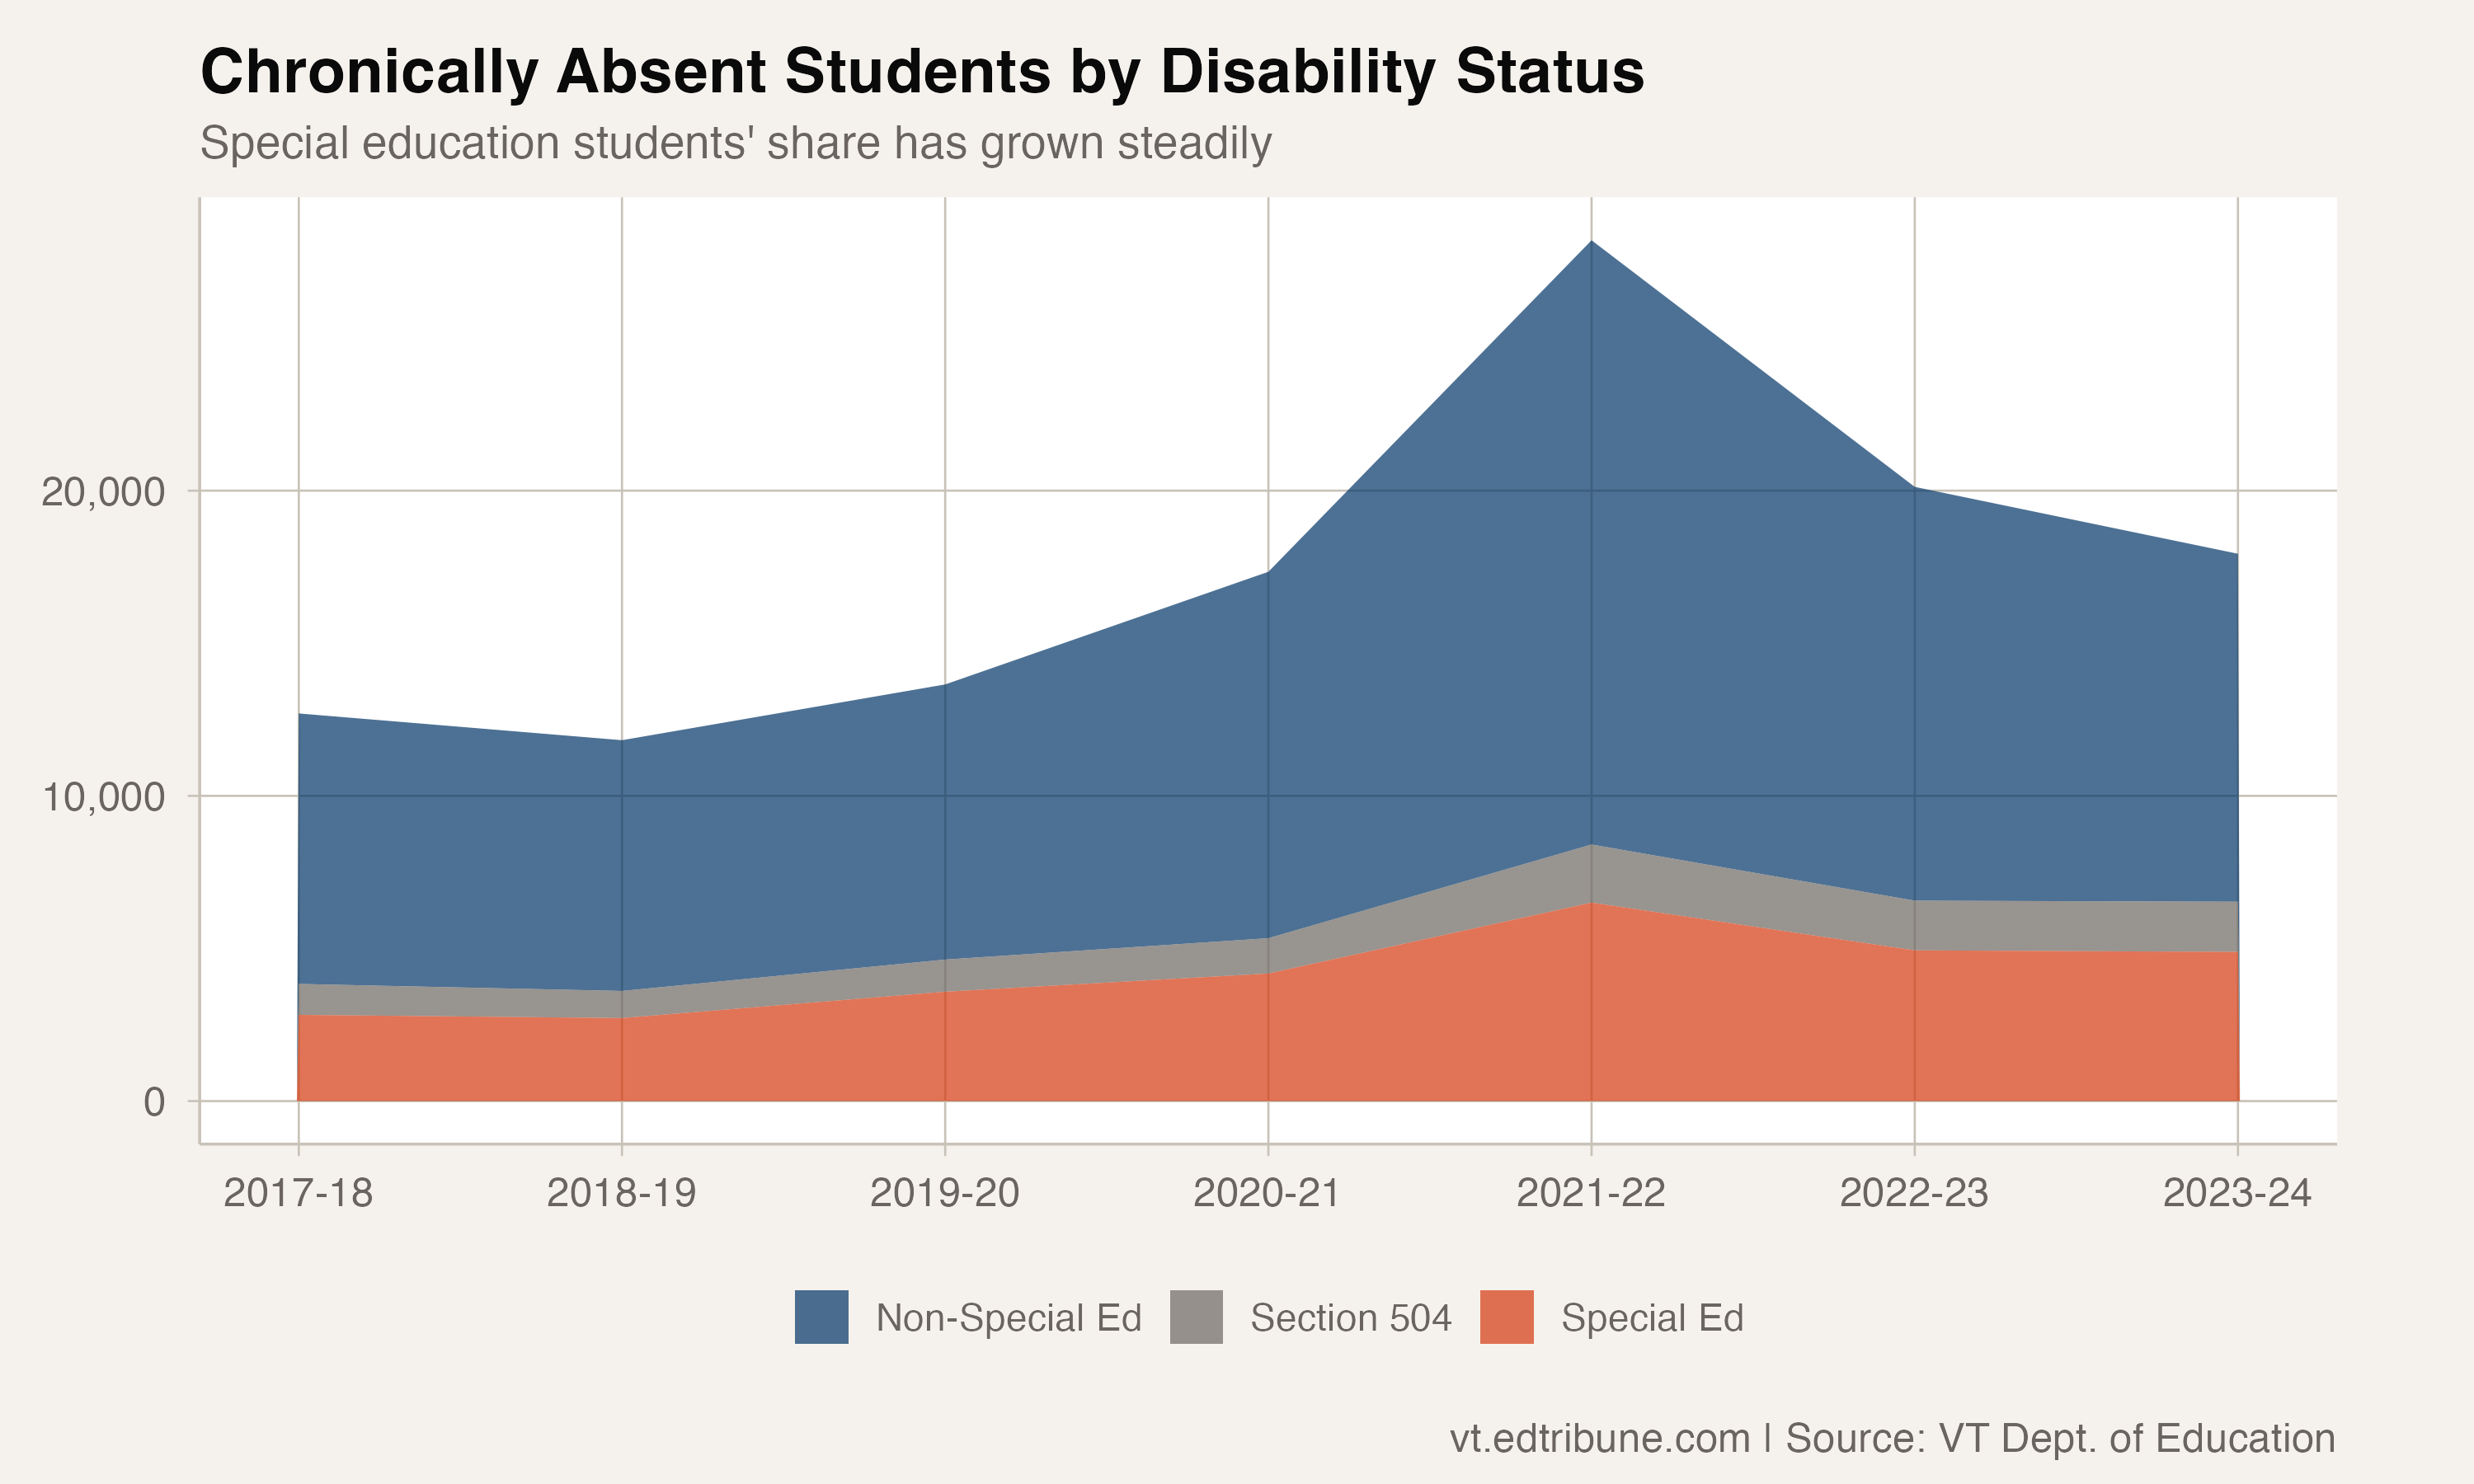
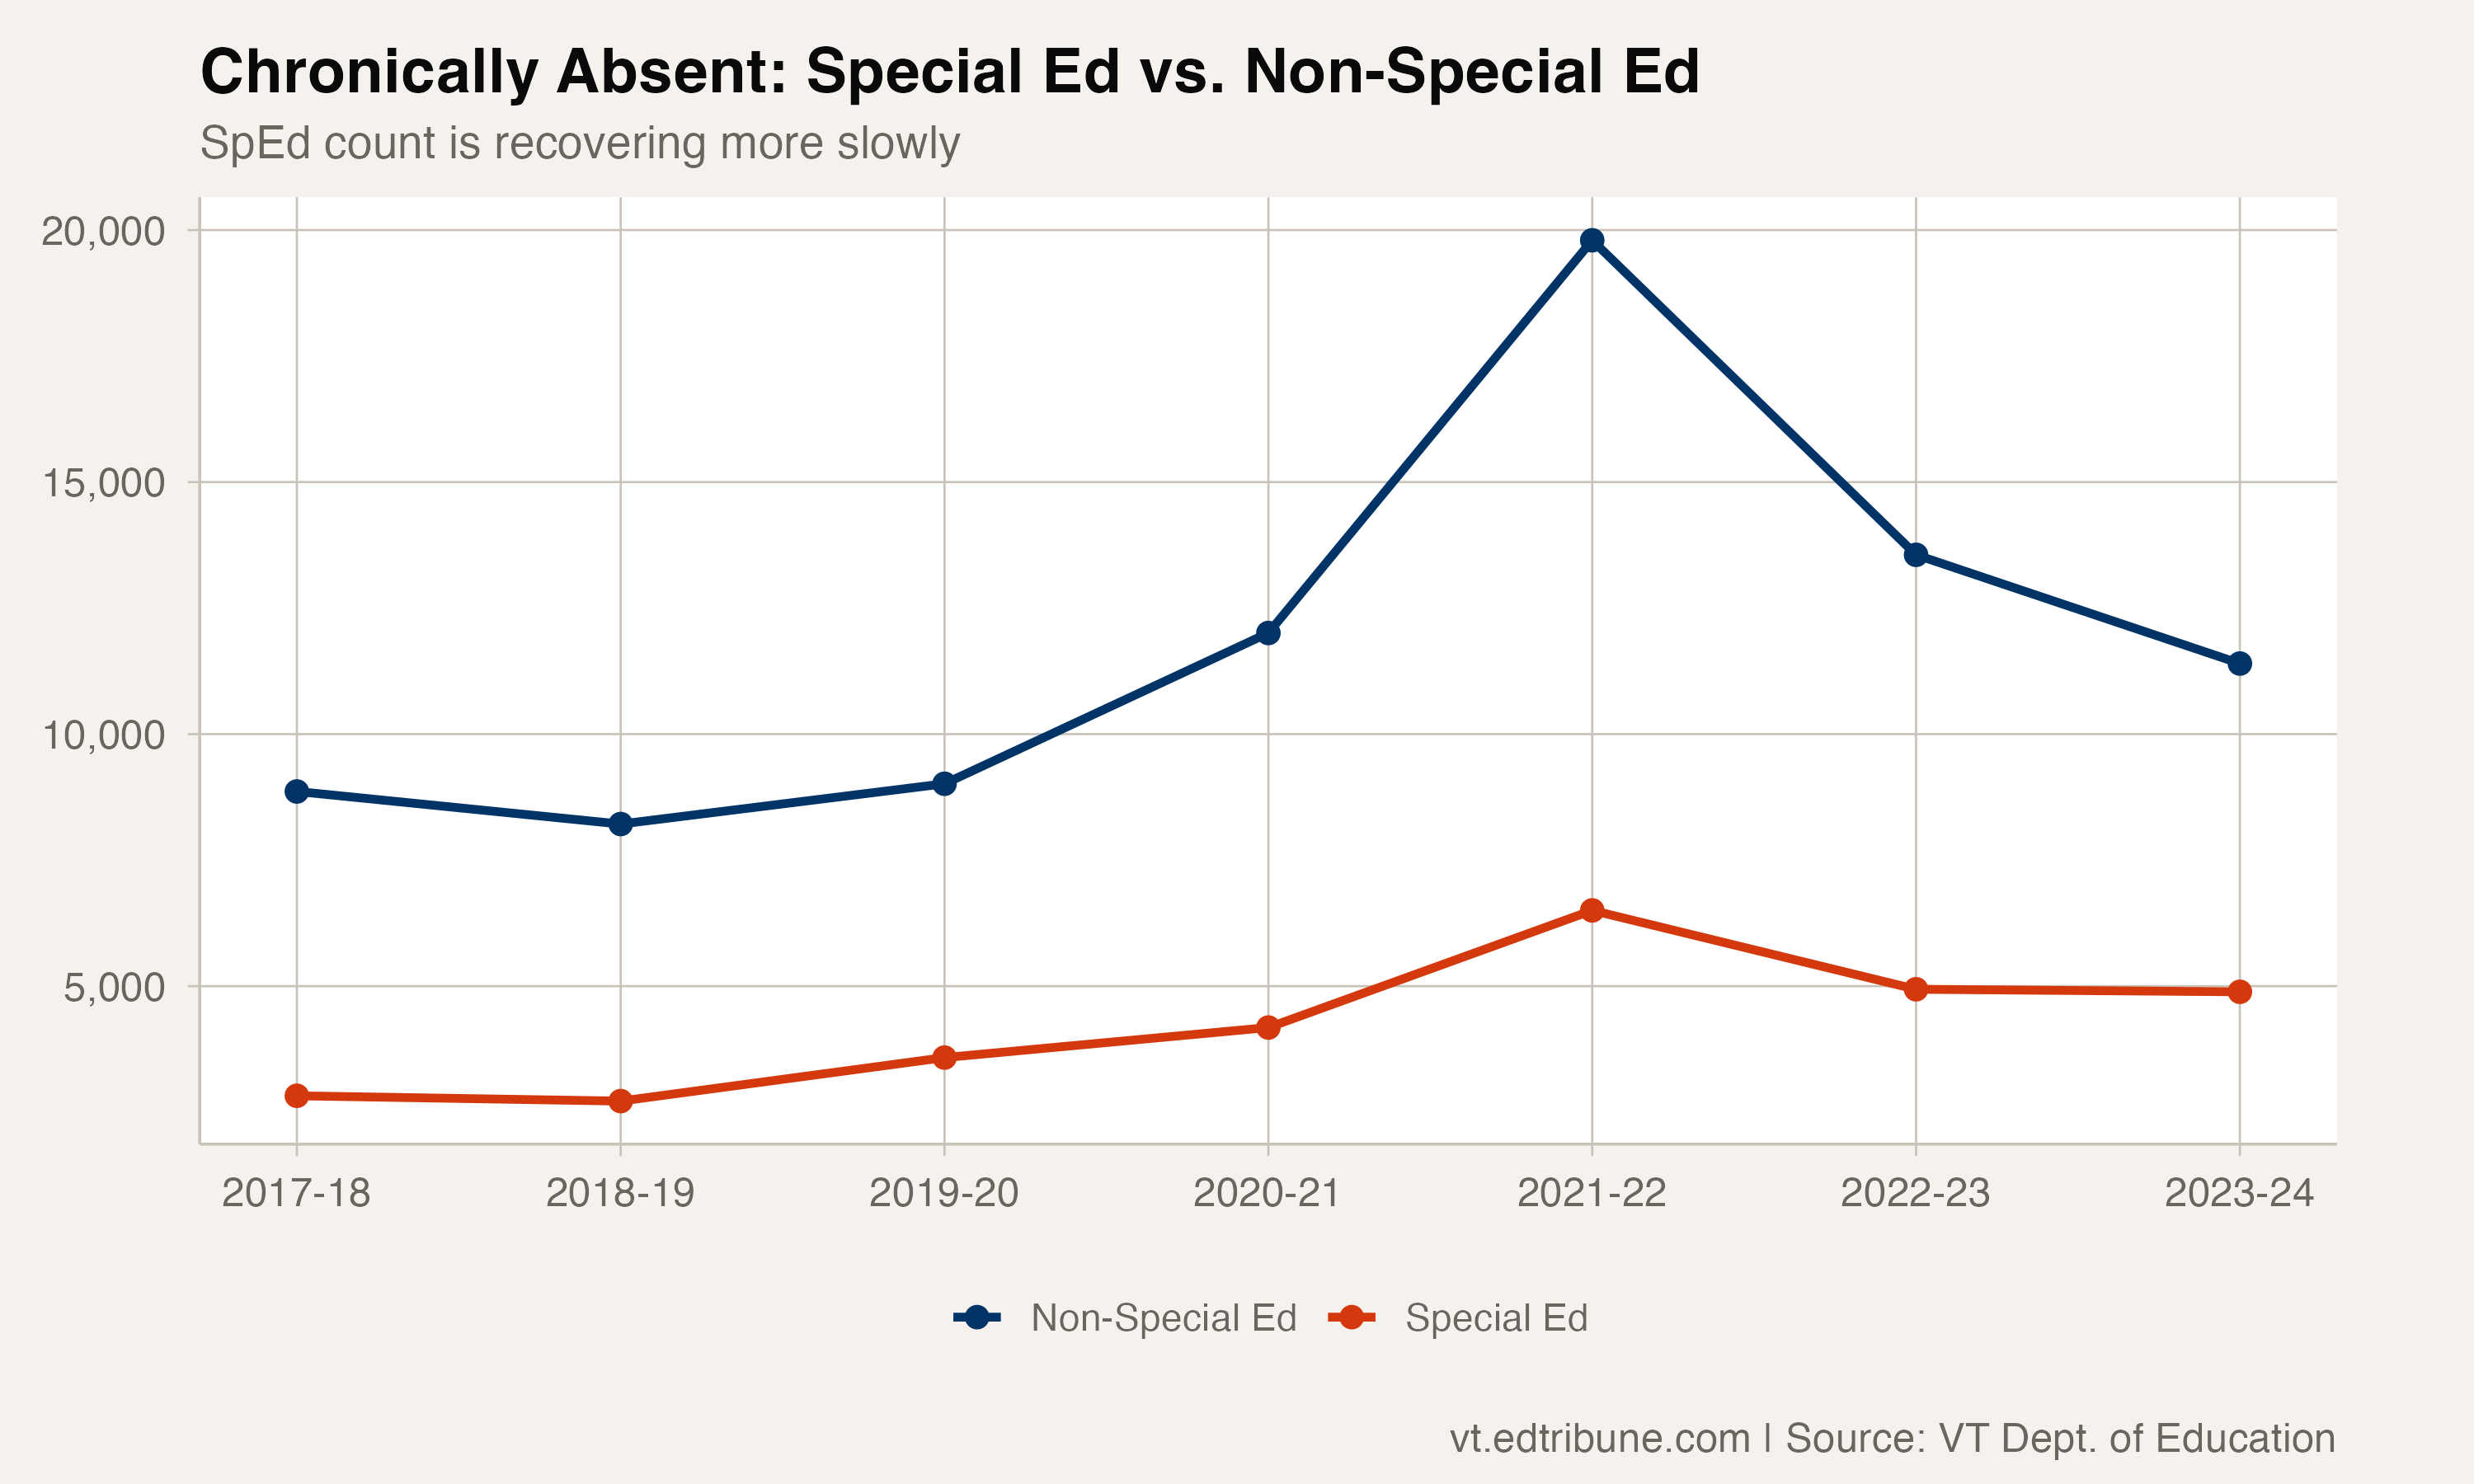
In absolute numbers, 4,888 students receiving special education services were chronically absent in 2023-24, down from a peak of 6,503 in 2021-22. That represents a 24.8% reduction from peak. Compare that to students who do not receive special education services, who fell from 19,797 to 11,400, a 42.4% reduction. Students receiving Section 504 accommodations, a related but distinct category, recovered only 13.6% from their peak (1,903 to 1,644).
Why the recovery is harder for students with disabilities
The reasons students receiving special education services are overrepresented in chronic absence data are structural, not mysterious. Students with Individualized Education Programs often have medical appointments, therapy sessions, and specialized evaluations that pull them out of school. Students with emotional or behavioral disabilities may have more difficulty managing the school environment consistently. Students with chronic health conditions miss school because their bodies require it.
None of these factors disappeared during COVID. Many intensified. Mental health diagnoses increased. Therapy waitlists grew. The transition back to in-person school was harder for students who relied on predictable routines and sensory environments, students whose routines had been disrupted for two years.
The result is visible in the trend lines. While the overall chronically absent count has fallen steadily since 2022, the count for students in special education has fallen more slowly. The gap widens each year.
Section 504: the slowest recovery
Students receiving Section 504 accommodations (those with disabilities who do not qualify for special education services but receive accommodations under federal civil rights law) have shown the weakest recovery of any subgroup tracked in Vermont's data. From 1,903 at the 2022 peak to 1,644 in 2024, a reduction of just 13.6%.
The Section 504 population is distinct from students in special education in important ways. Students receiving Section 504 accommodations often have chronic health conditions (diabetes, severe allergies, ADHD) or mental health diagnoses (anxiety, depression) that affect attendance without requiring the full apparatus of an IEP. Their school experience is less intensively supported, which may explain why their attendance recovery has lagged even behind students receiving special education services.
The funding context
Vermont spends among the highest per-pupil amounts in the nation, and its special education funding formula provides substantial additional resources. Under the incoming Act 73 formula, the base per-pupil amount is $15,033, with weighted allocations for students with higher needs. Those dollars fund staff, services, and supports that are predicated on student presence. When one in four chronically absent students receives special education services, the return on that investment diminishes proportionally.
The 2023 Youth Risk Behavior Survey found that one-third of Vermont high school students struggle with poor mental health. For students with identified disabilities, the rates are higher. The overlap between disability, mental health, and chronic absence creates a compounding effect that attendance interventions designed for the general population may not adequately address.
Vermont cannot break its chronic absenteeism data by race or ethnicity. It can break it by disability status. That lens reveals that the student population most entitled to specialized support is also the population recovering most slowly from the attendance crisis. The strategies working for students without disabilities are not reaching students with disabilities at the same pace, and the gap is growing each year that passes.
Detailed code that reproduces the analysis and figures in this article is available exclusively to EdTribune subscribers.
Discussion
Sign in to join the discussion.
Loading comments...