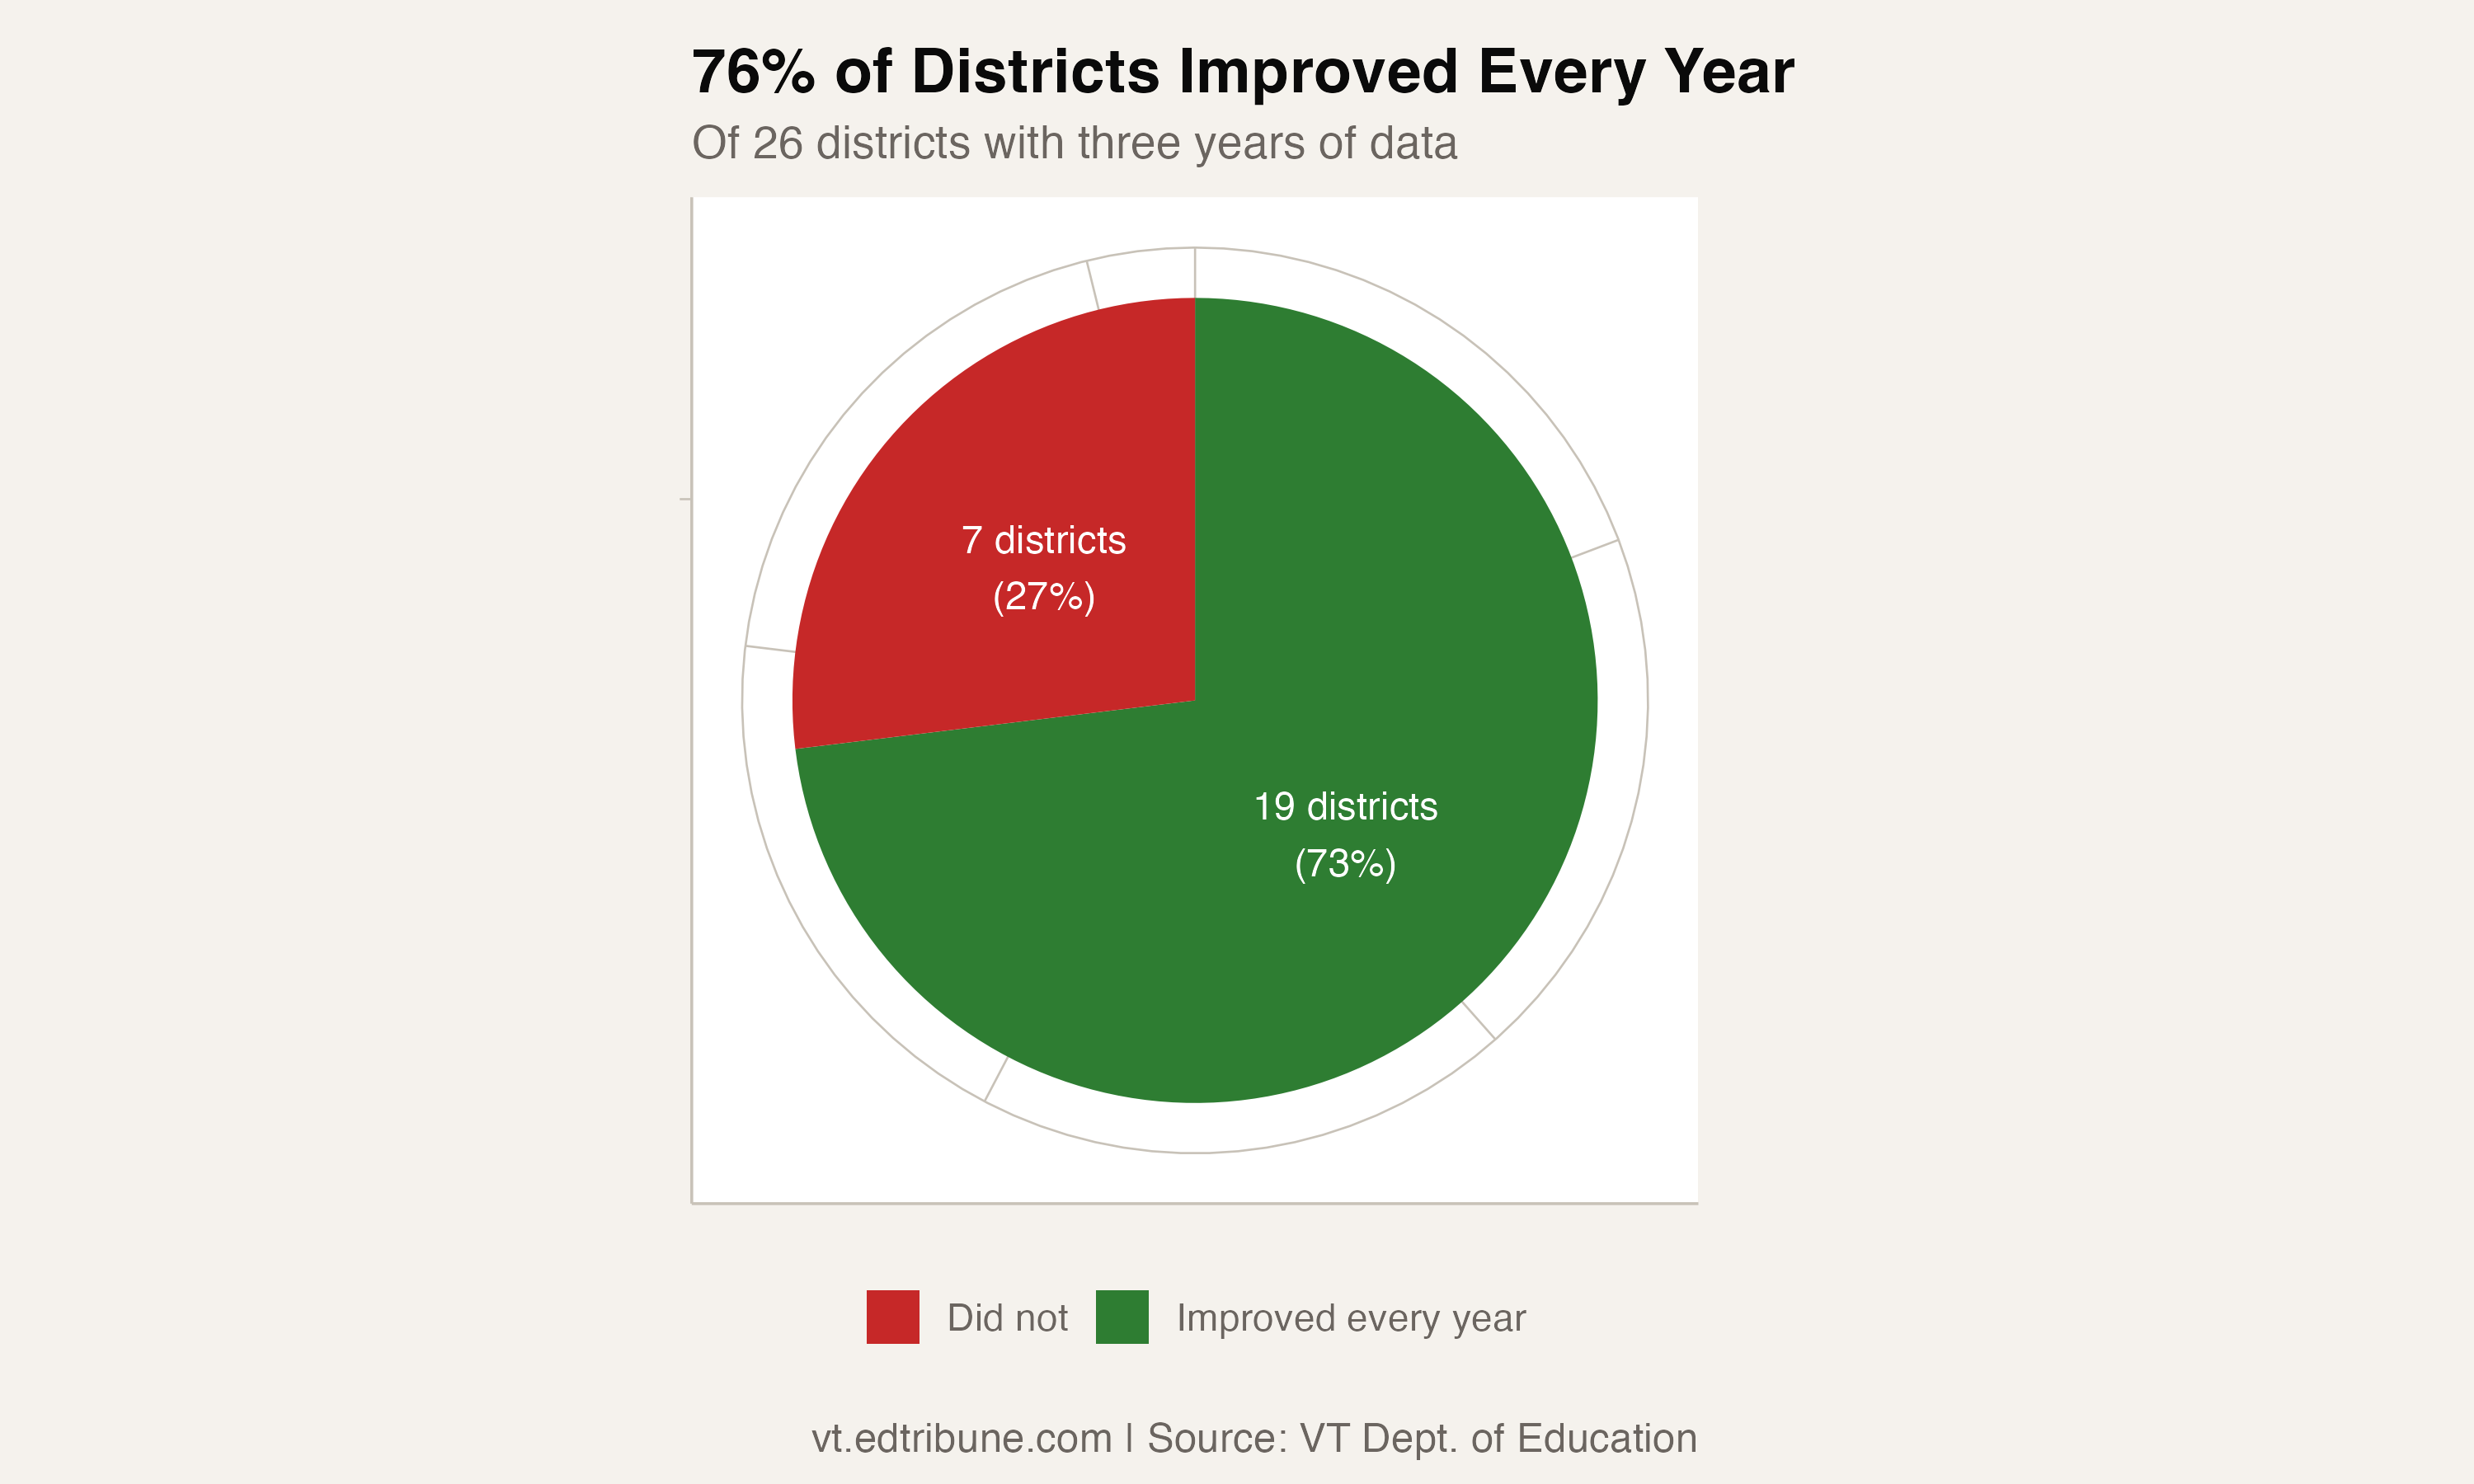
One number in Vermont's chronic absenteeism data stands out for the right reason: 19 of 26 districts with complete three-year data improved their chronic rate every single year from the 2021-22 peak through 2023-24. That is a 73% consecutive-improvement rate. The size of the gains varied widely, but roughly three-quarters of districts moved in the right direction without interruption.
Who improved, and by how much
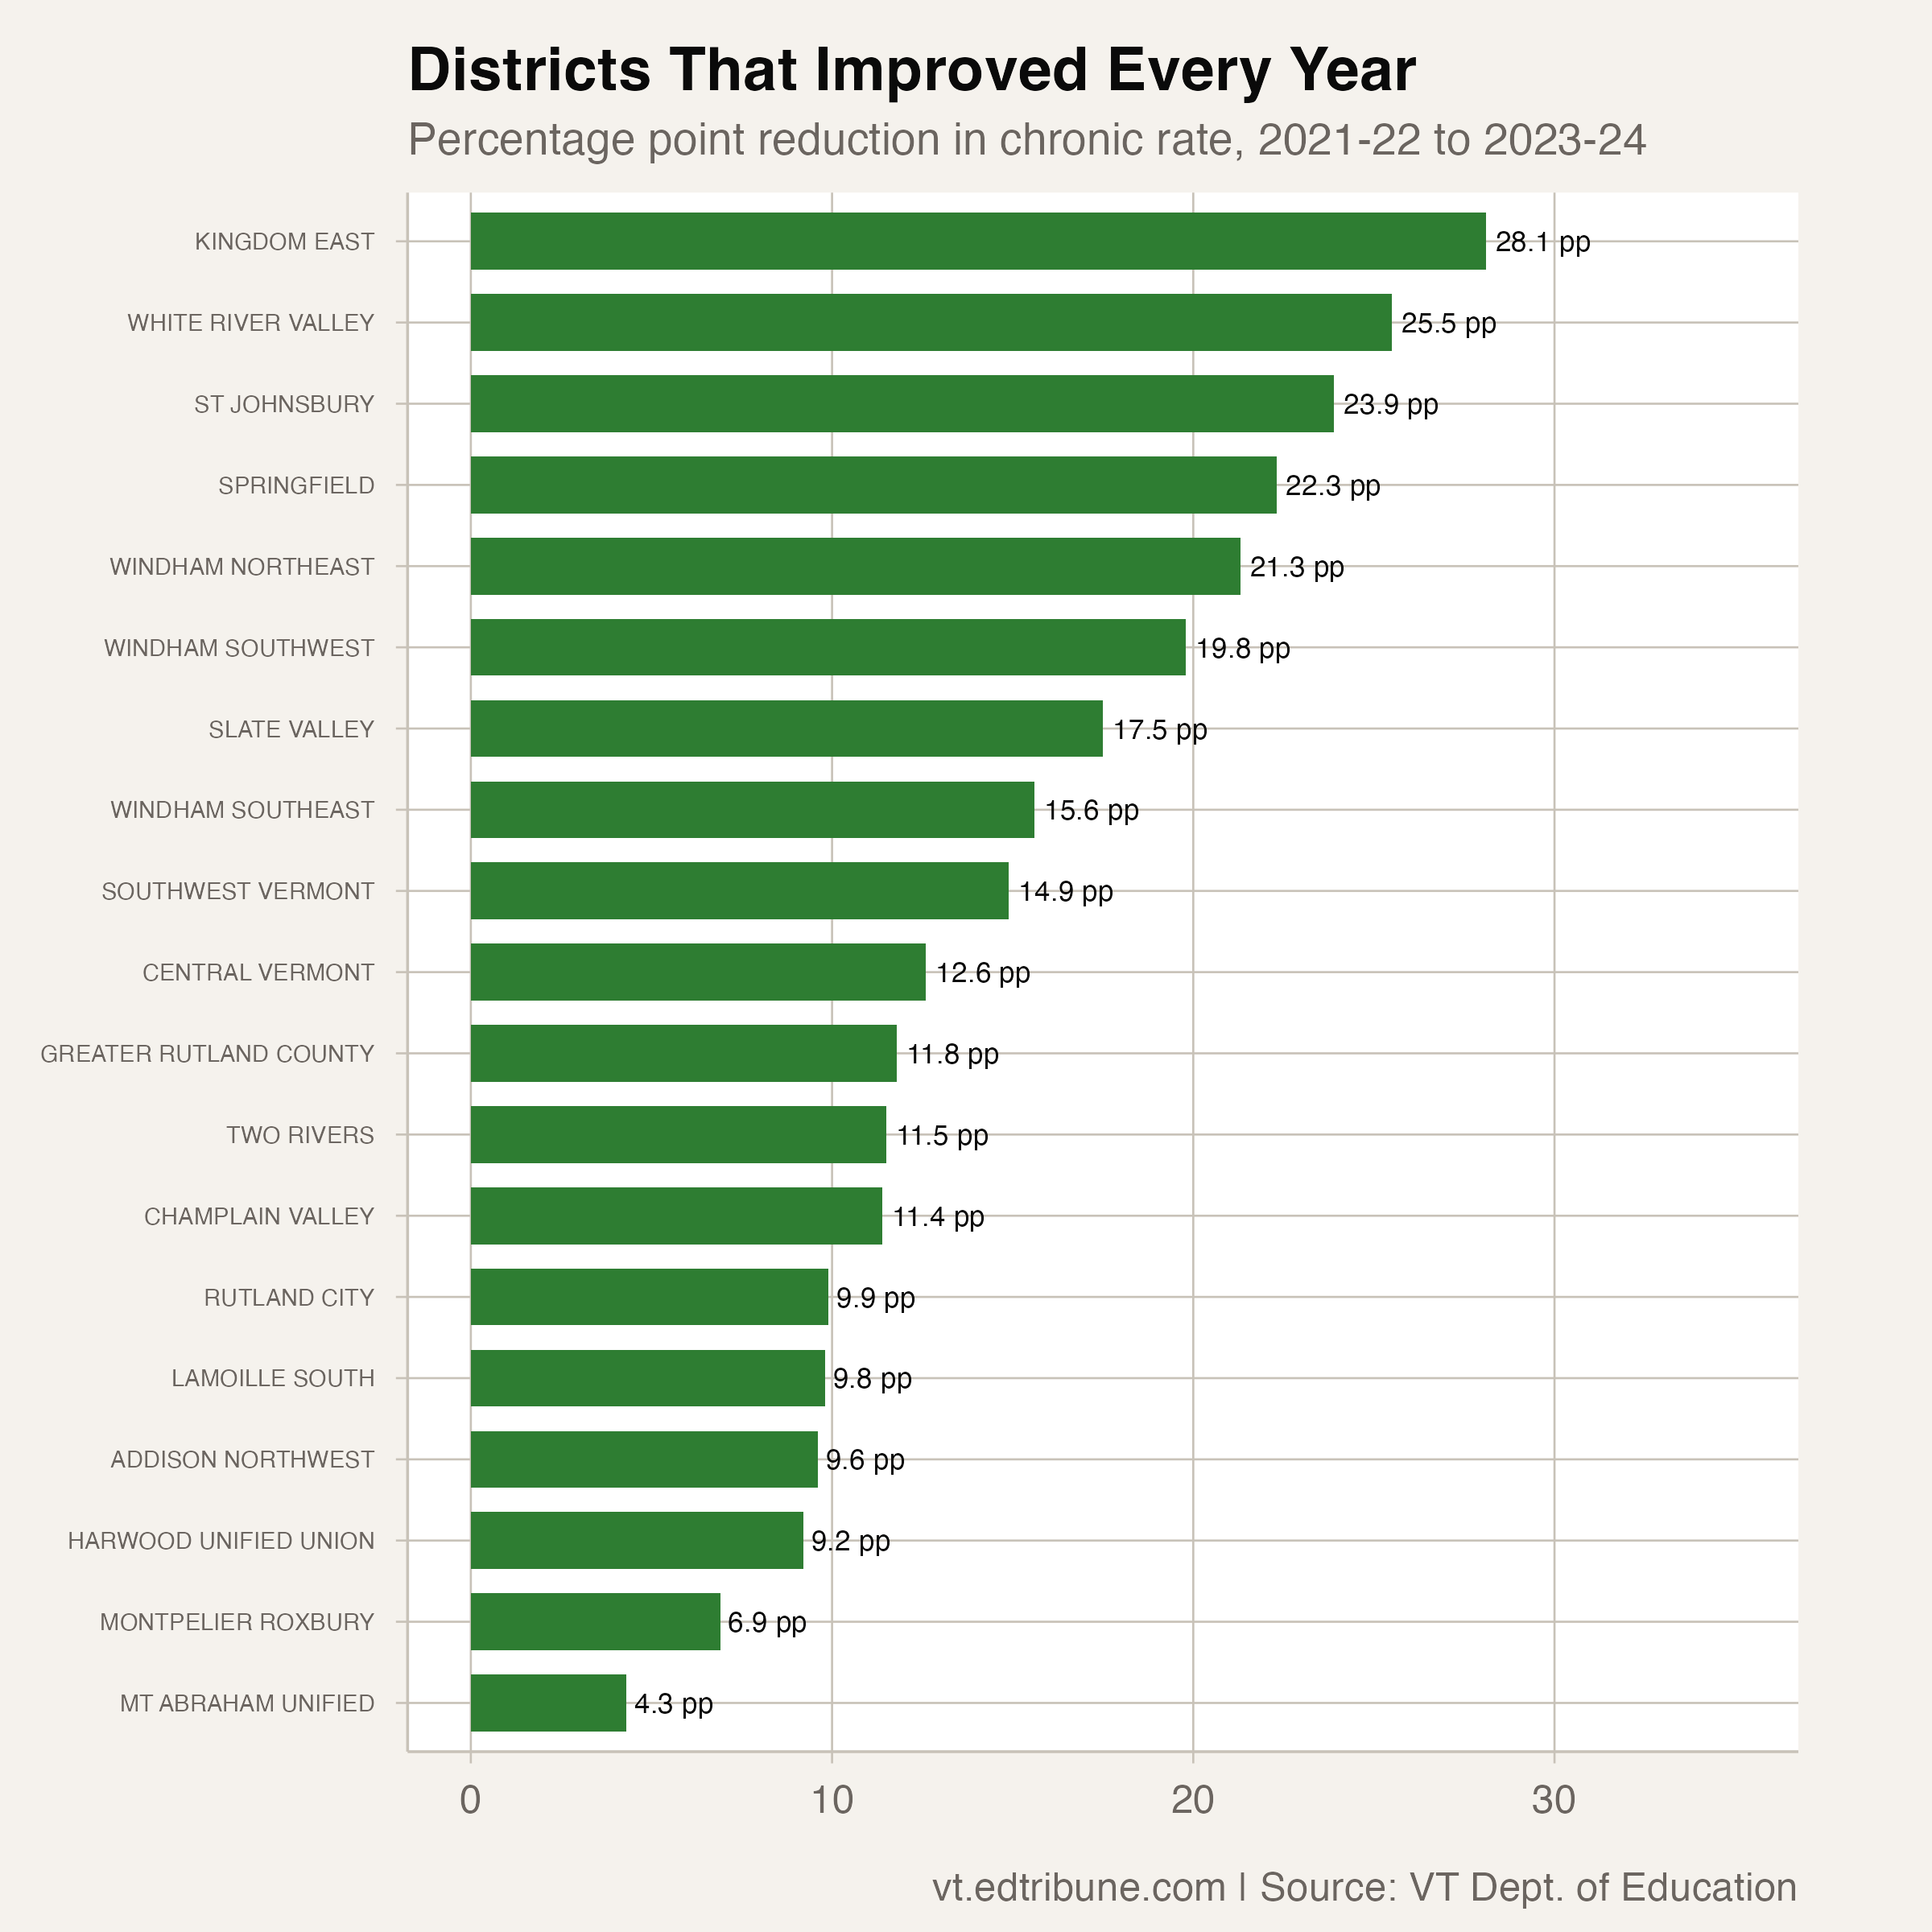
The spread is wide. Kingdom East SD↗ET leads with a 28.1 percentage point improvement, dropping from 50.6% to 22.5% in two years. White River Valley SU fell 25.5 points (45.9% to 20.4%). St. Johnsbury cut 23.9 points. Springfield cut 22.3. These are large reductions: rates that were above 45% are now in the low 20s.
At the other end, Mt. Abraham Unified School District improved by 4.3 points (20.2% to 15.9%). Montpelier Roxbury fell 6.9 points. Addison Northwest dropped 9.6. These are smaller gains, but in the context of a persistent statewide problem, sustained improvement of any magnitude is notable.
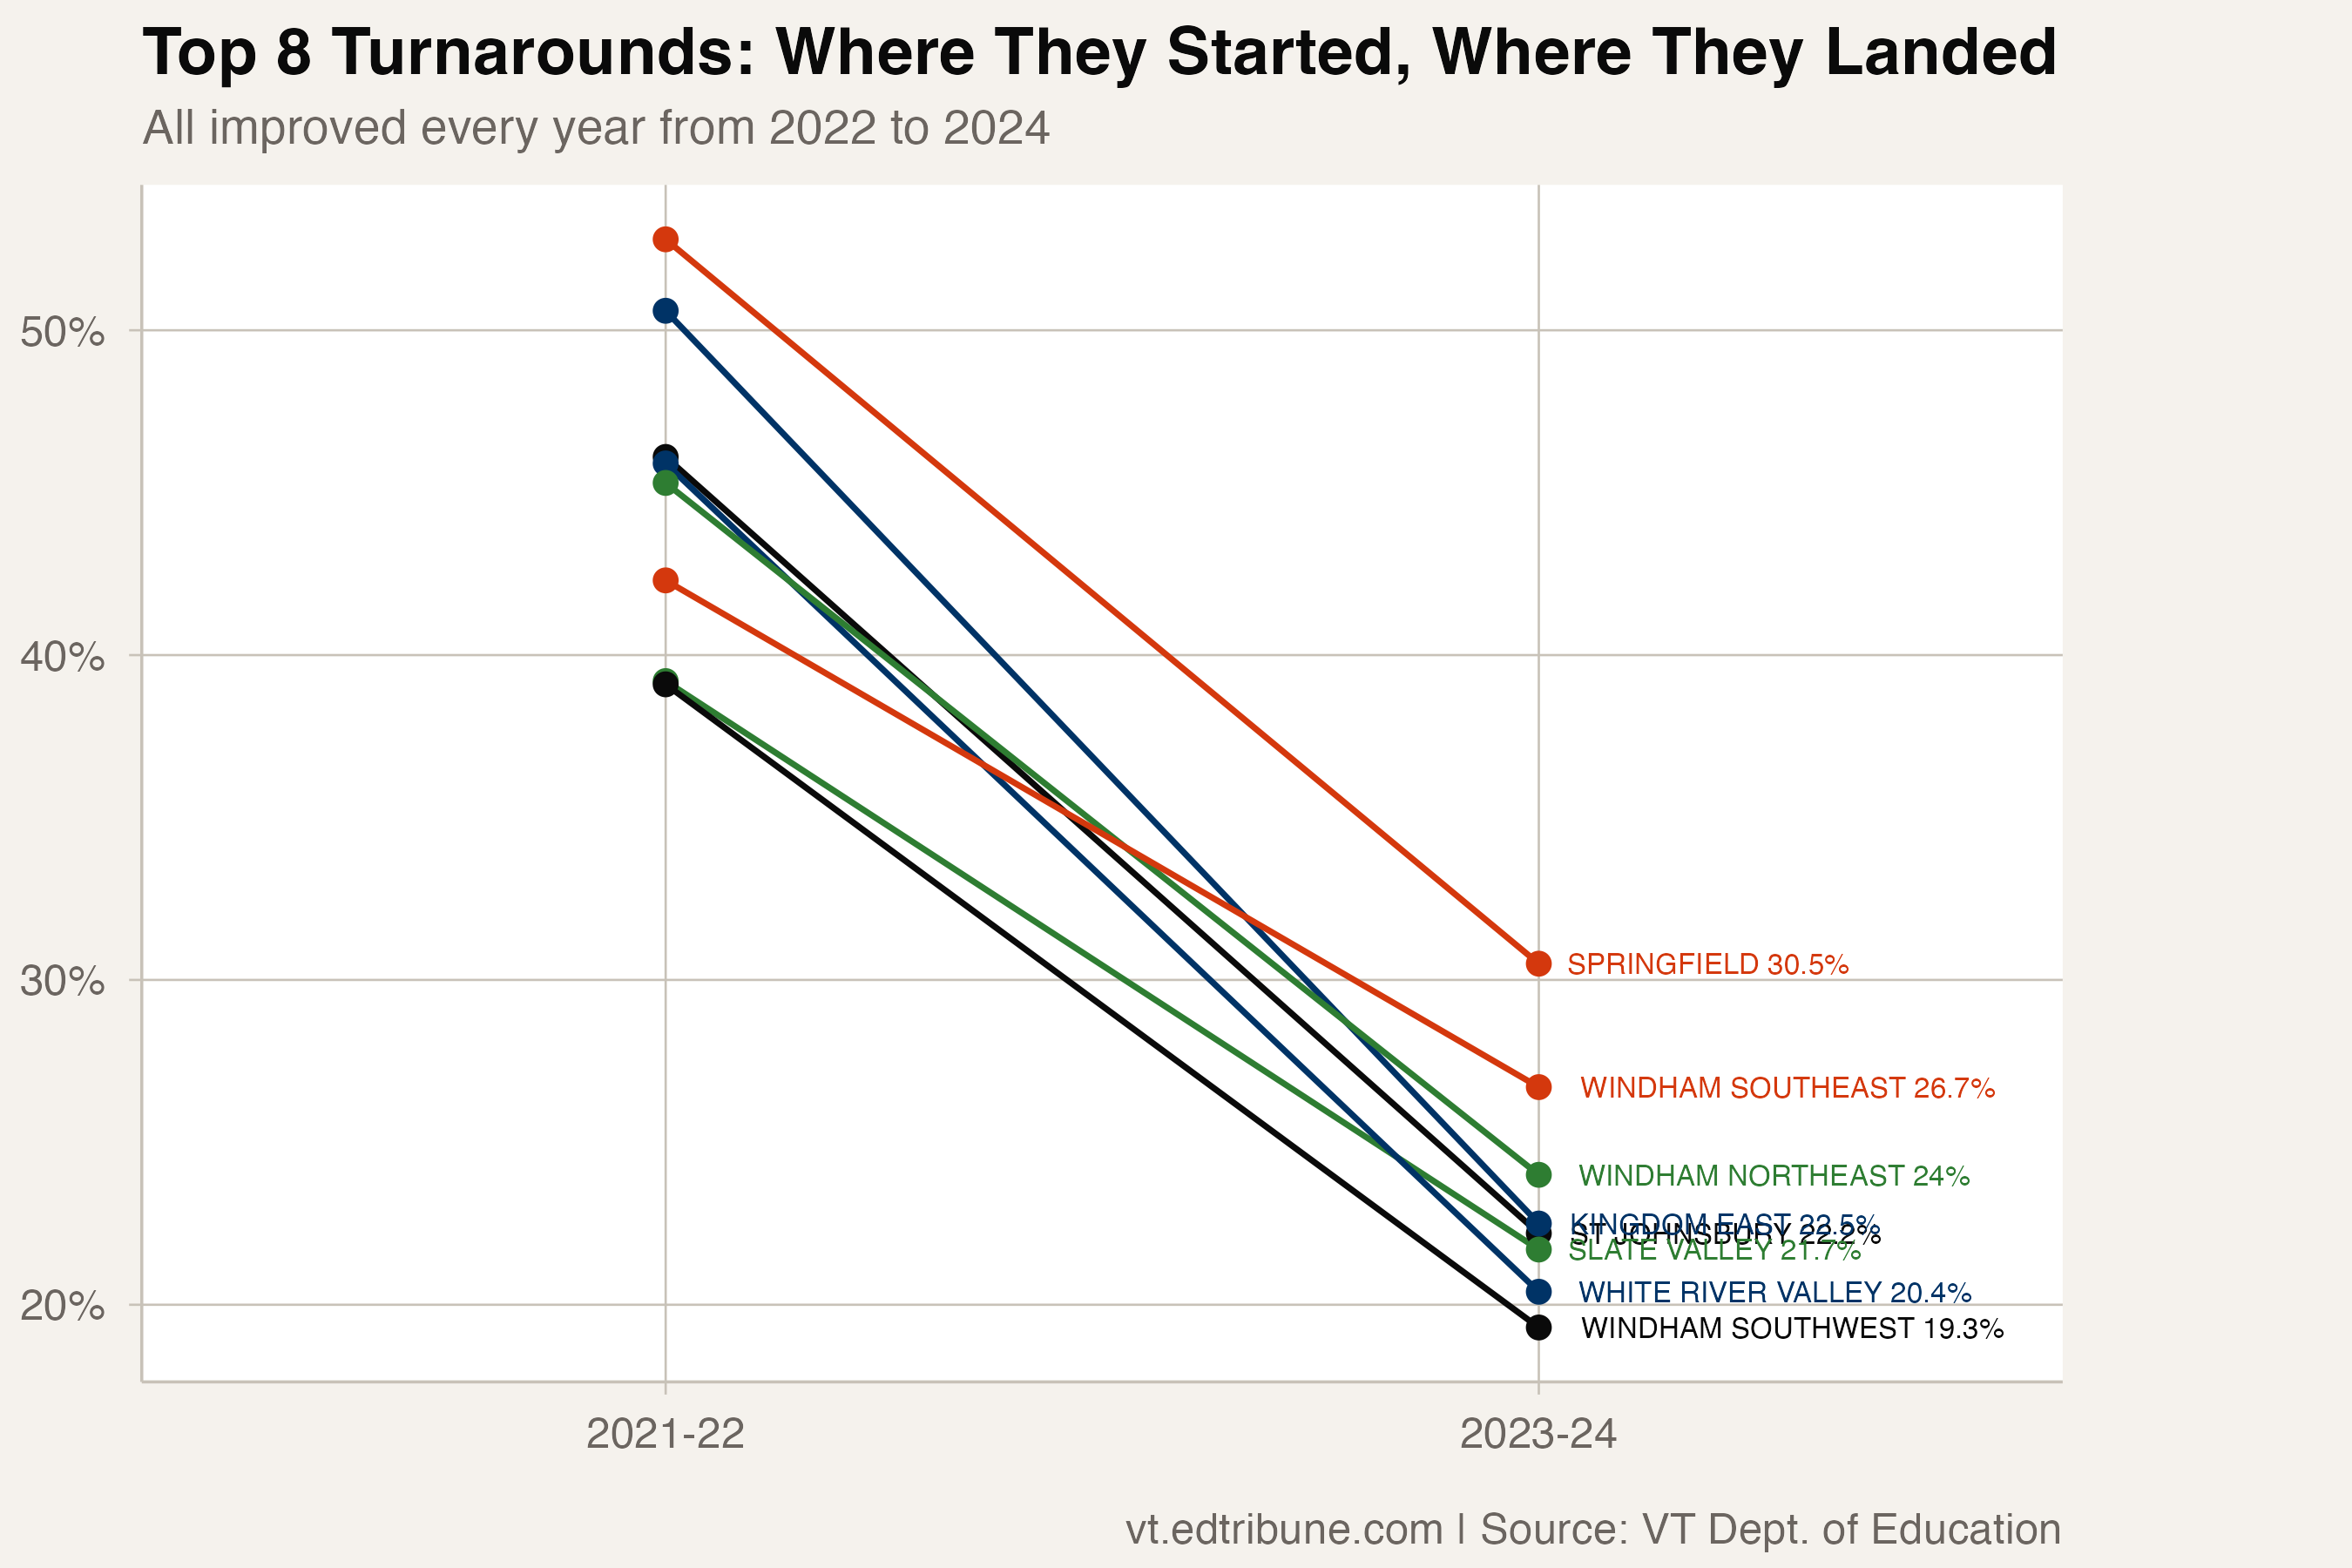
The pattern across all 19 is consistent direction, not consistent magnitude. What unites Kingdom East's 28-point drop and Mt. Abraham's 4-point drop is that both districts got better in 2023 and then got better again in 2024, without stalling or reversing in between. In a problem as complex as chronic absenteeism, sustained directional improvement may matter more than the size of any single year's gain.
Still above the line
Improvement is not recovery. Of the 19 districts that improved every year, 7 still have chronic rates above the statewide average of 24.3%. Rutland City SD↗ET improved from 66.6% to 56.7%, a 9.9 point drop, and remains the highest-rate district in the state. Southwest Vermont SU↗ET fell from 51.9% to 37.0% and still has more than a third of its students chronically absent.
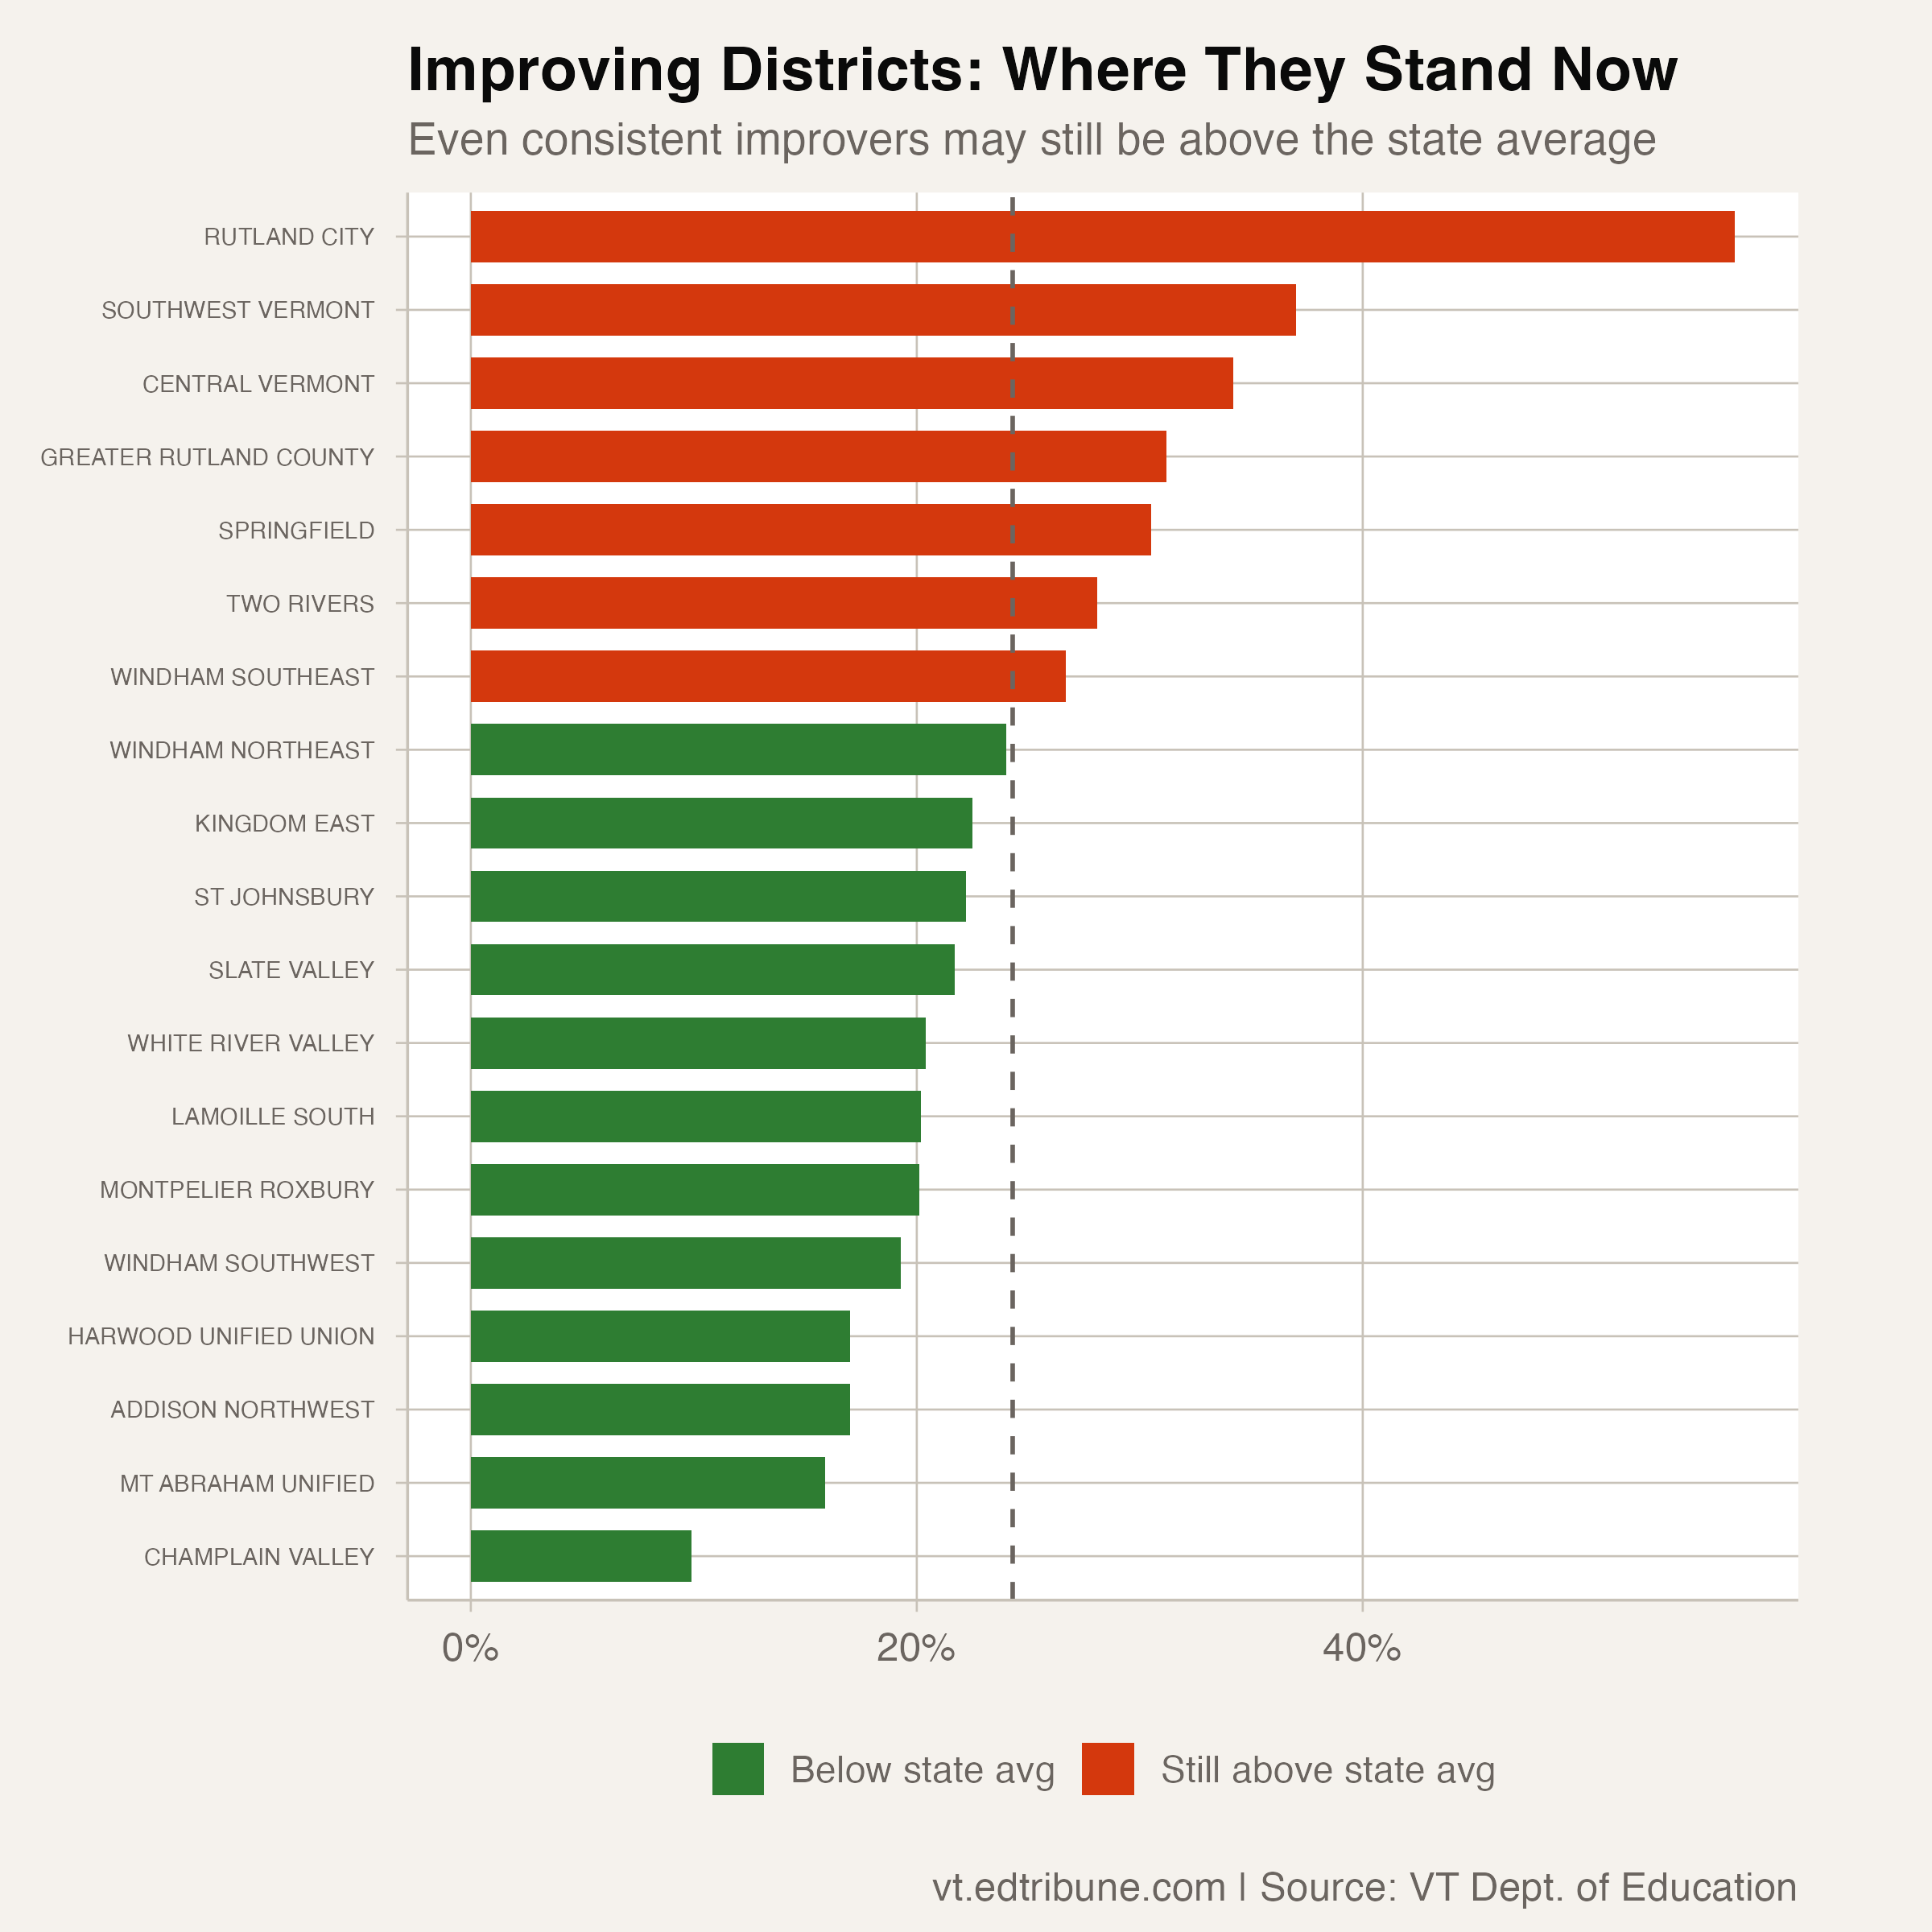
The other 12 improvers have already pulled below the state average. They include some of Vermont's larger operations: Champlain Valley SD↗ET (9.9%), Harwood Unified Union (17.0%), Mt. Abraham (15.9%), and Addison Northwest (17.0%). These are predominantly Chittenden and Addison County districts, the state's more affluent corridor.
The seven that did not
Seven districts either stalled or reversed. Winooski SD↗ET saw the sharpest move: its rate jumped from 29.2% to 52.5% in a single year. Hartford SD↗ET rose from 32.0% to 37.0%. Essex North SU, a small career-technical district, fluctuated. The remaining four showed mixed trajectories: improvement one year, regression the next.
The divergence between the 19 improvers and the 7 non-improvers does not map neatly onto any single variable. Size, geography, poverty level, and urbanicity are all mixed. Winooski's reversal appears connected to immigration enforcement anxieties specific to its diverse community. Hartford's increase has no similarly clear external driver.
The deceleration within improvement
Even among the 19 consistent improvers, the pace is slowing. Many showed large drops between 2022 and 2023 but smaller drops between 2023 and 2024. Southwest Vermont: -14.0 points then -0.9 points. Two Rivers: -11.4 then -0.1. Central Vermont: -11.2 then -1.4. The easy gains are exhausted. What remains are the students whose attendance barriers are more deeply rooted: medical, economic, familial, or psychological.
This mirrors the statewide pattern: a 10.5-point improvement in the first year of recovery, a 2.6-point improvement in the second. The 73% consecutive-improvement rate shows Vermont districts are making real progress. The deceleration suggests the students still above the 10% threshold face attendance barriers that do not yield to the same interventions that brought the first wave back.
Detailed code that reproduces the analysis and figures in this article is available exclusively to EdTribune subscribers.
Discussion
Sign in to join the discussion.
Loading comments...