Correction (May 29, 2026): An earlier version stated that the chronic absenteeism range among mid-sized districts spanned "from Harwood's 17.0%." The lowest rate in that group belongs to Mt Abraham at about 16%. The passage has been corrected.
Harwood Unified Union Supervisory District↗ET enrolls 1,794 students. Rutland City SD↗ET enrolls 1,931. They are nearly identical in size, both supervisory districts in rural Vermont, both serving communities of similar scale. In 2023-24, Harwood's chronic absenteeism rate was 17.0%. Rutland City's was 56.7%. The gap between them is 39.7 percentage points.
That is not a rounding error or a temporary fluctuation. It is a structural divide that persists across years and resists simple explanation.
The comparison
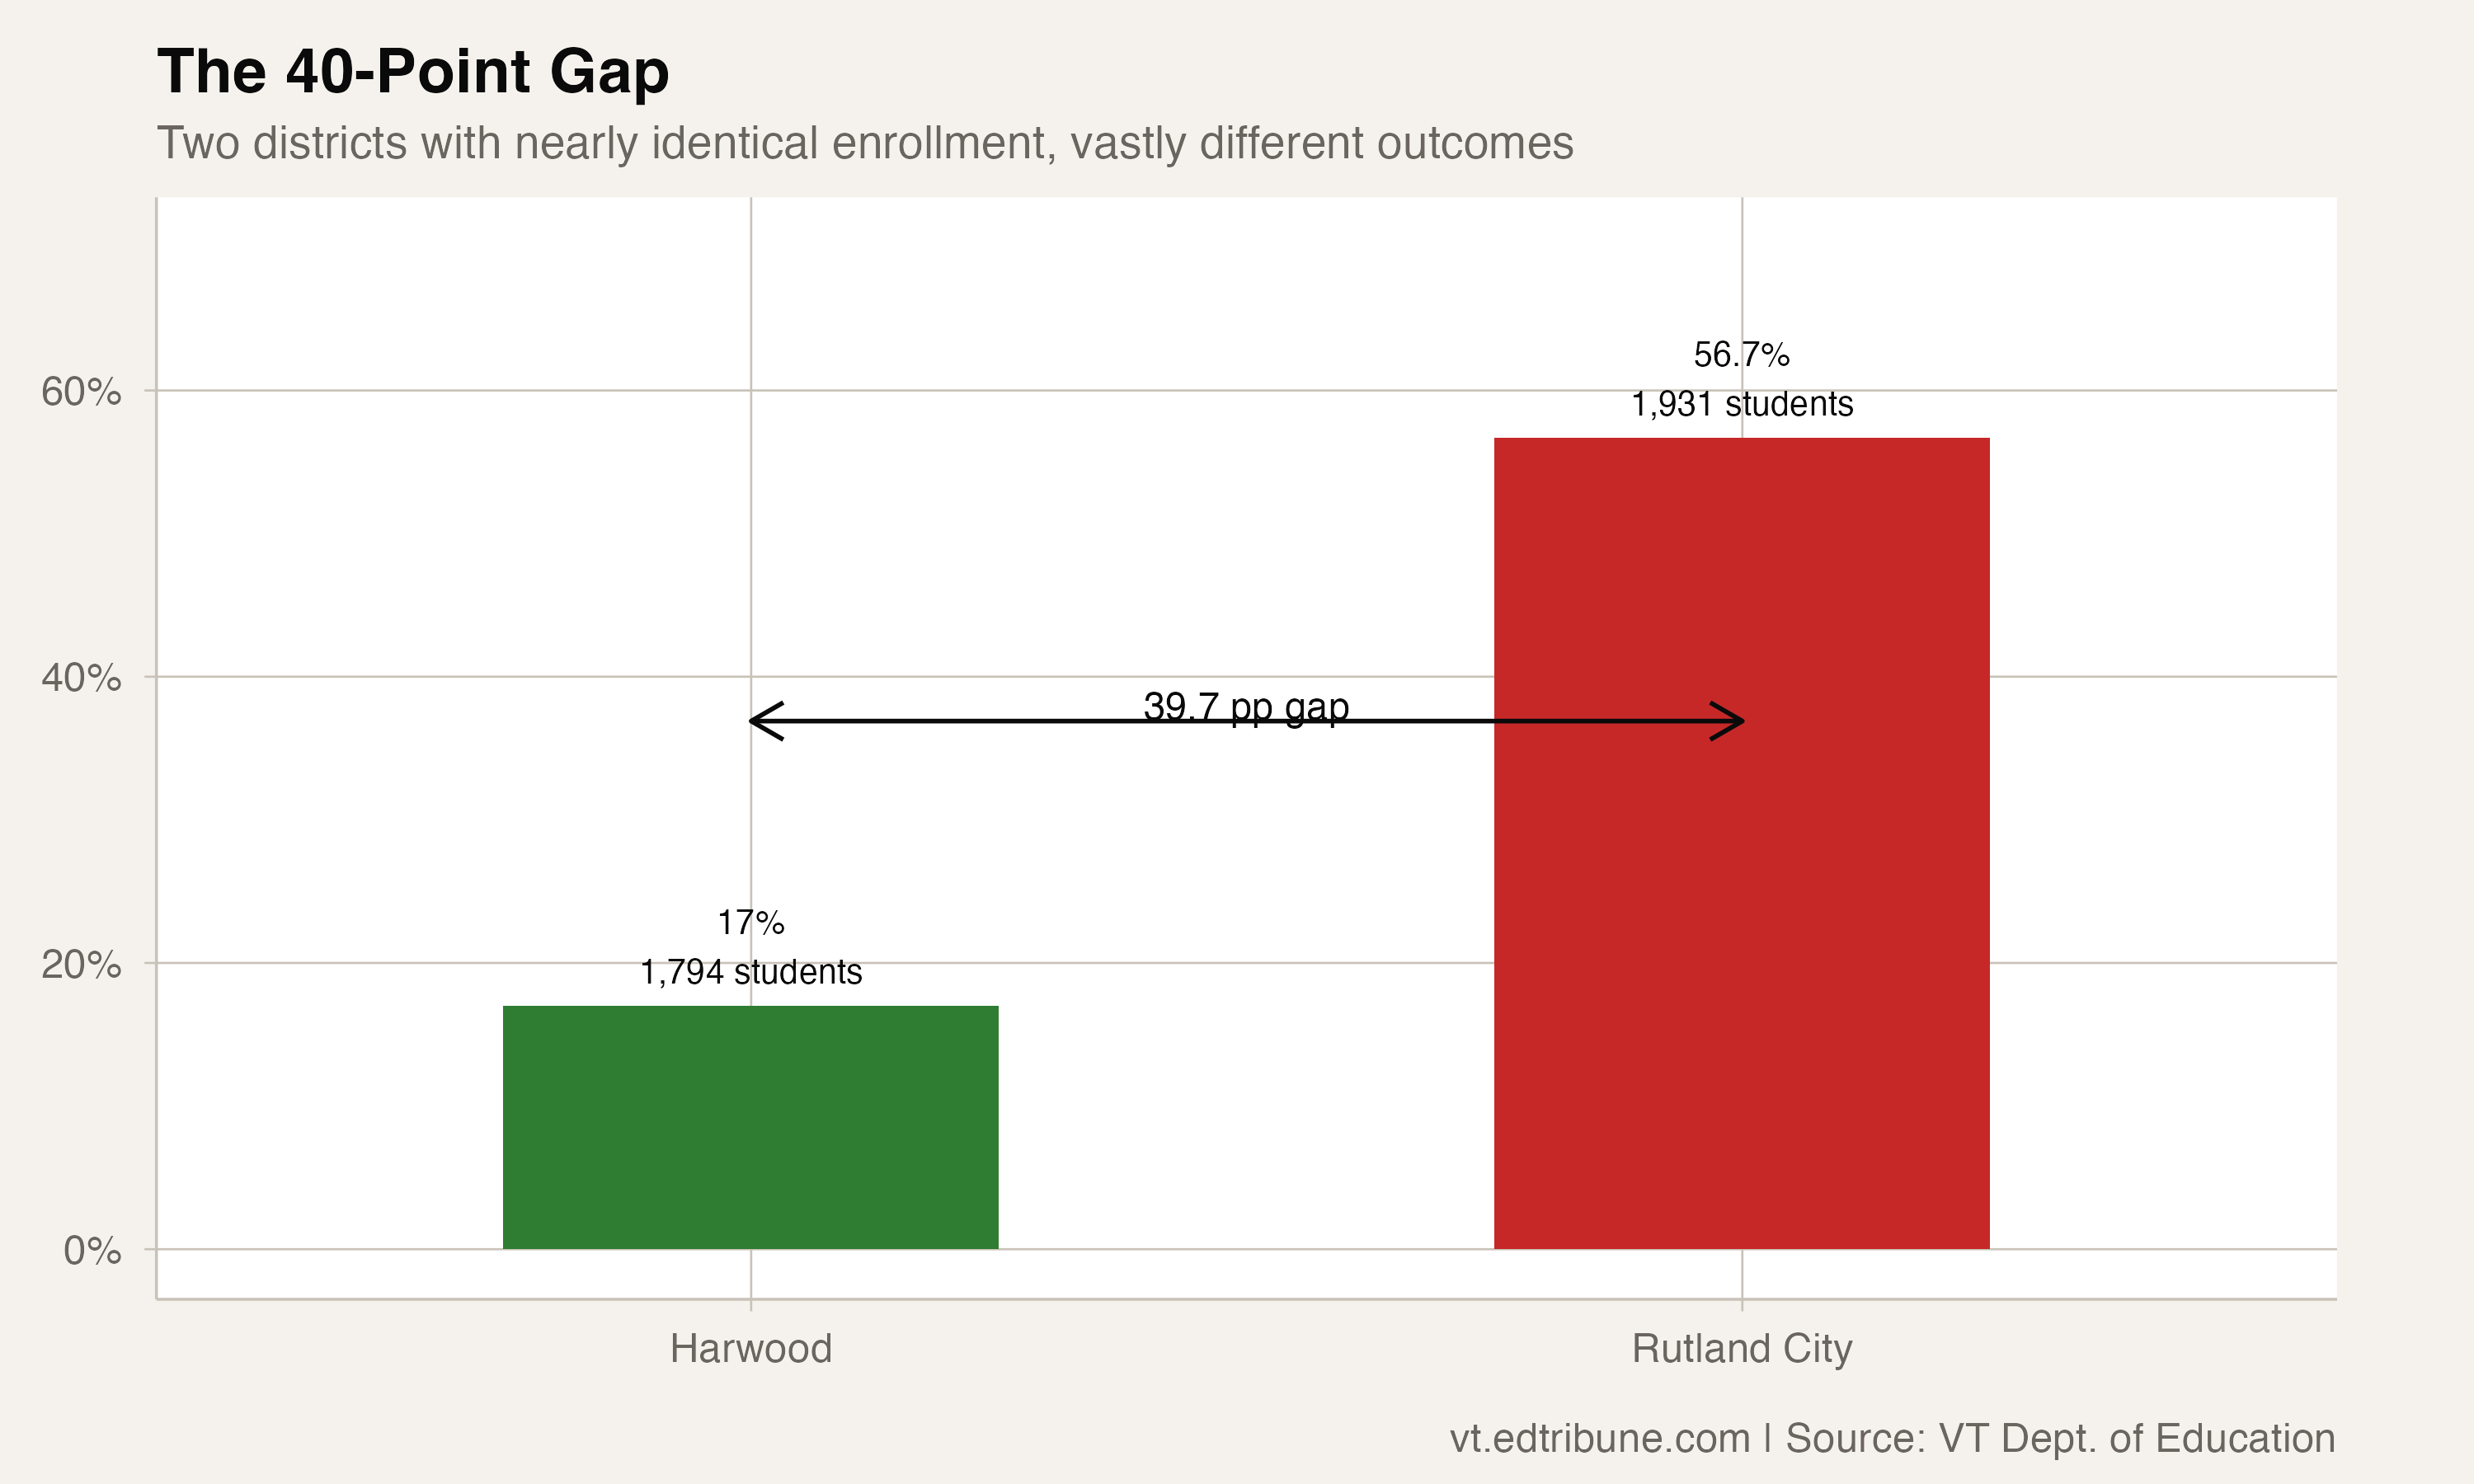
At Harwood, 305 of 1,794 students missed at least 10% of school. At Rutland City, 1,095 of 1,931 did. Roughly the same number of families, the same state education system, the same pandemic. The outcomes could not be more different.
Add a third point of comparison: Addison Central SD↗ET, 30 miles southwest of Harwood and geographically closer to Rutland. Addison Central enrolls 1,757 students and posts a 19.0% chronic rate. Three districts, all between 1,700 and 1,950 students, with rates of 17.0%, 19.0%, and 56.7%.
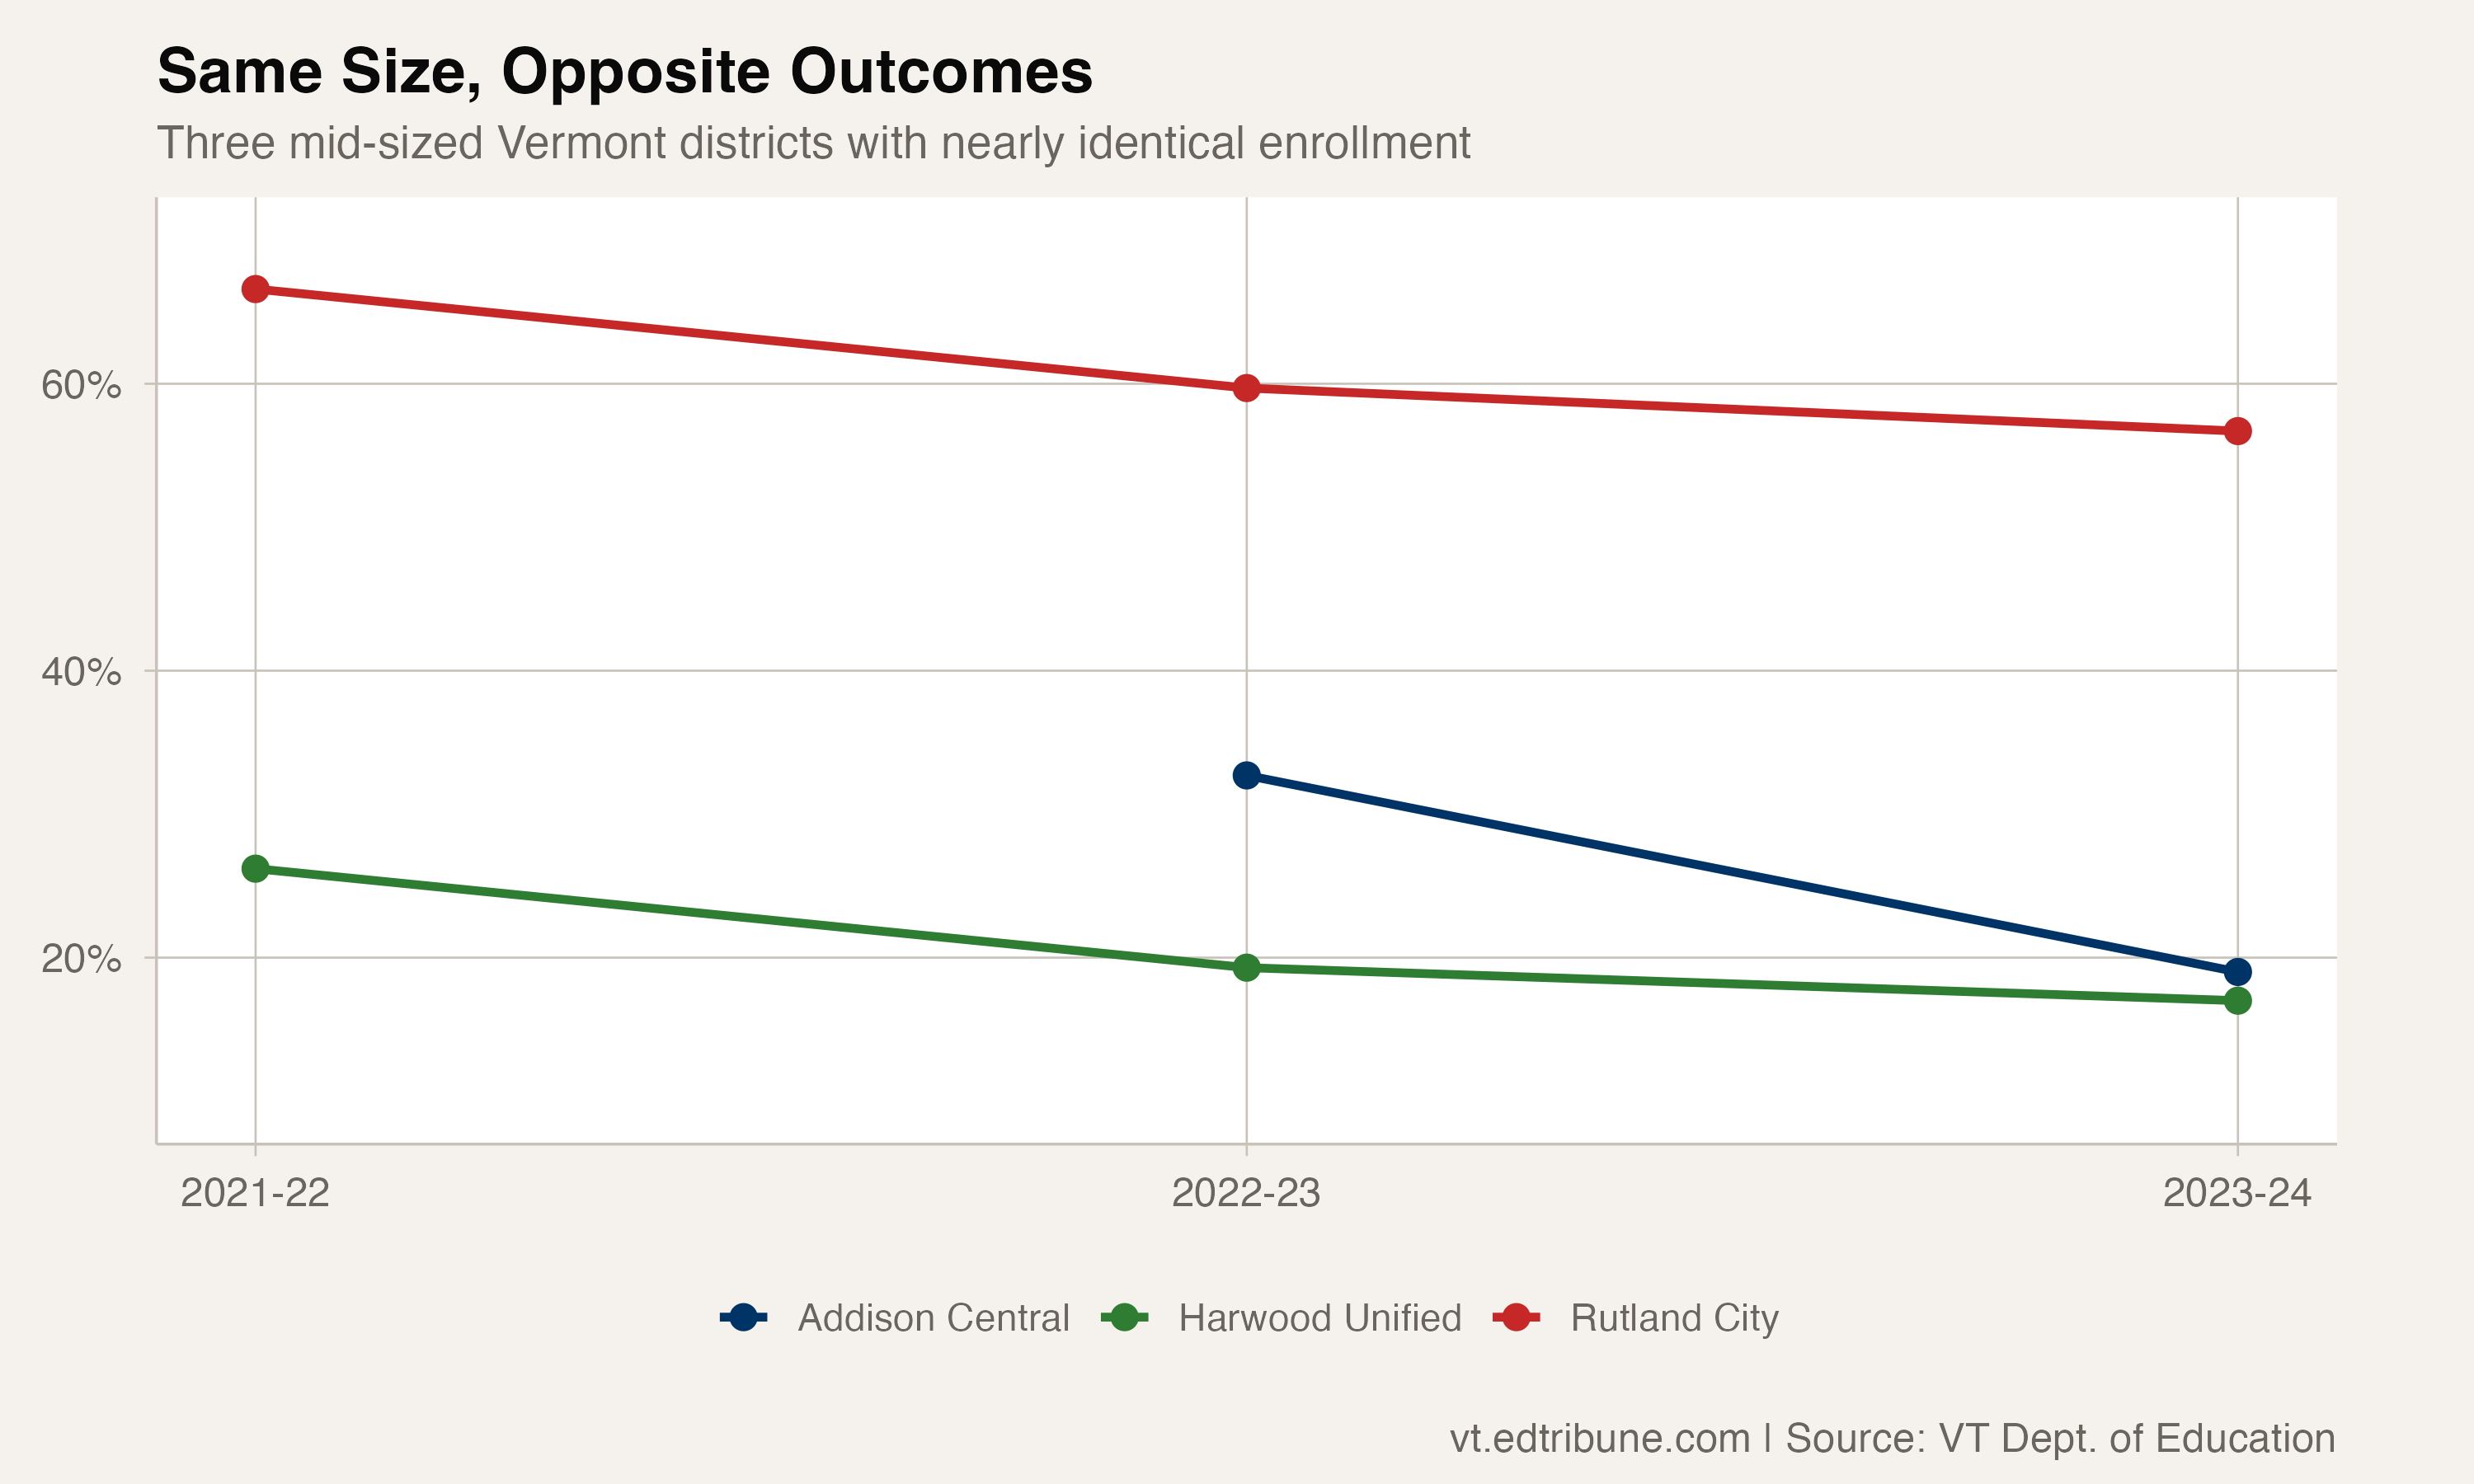
The trajectories deepen the comparison. All three spiked in 2021-22: Harwood to 26.2%, Addison Central to an unknown figure (no reliable 2022 data), and Rutland City to 66.6%. But the recovery paths diverged. Harwood dropped 9.2 points in two years. Rutland City dropped 9.9 points, slightly more. Yet the starting points were so far apart that Rutland's faster improvement did not close the gap.
Size is not the explanation
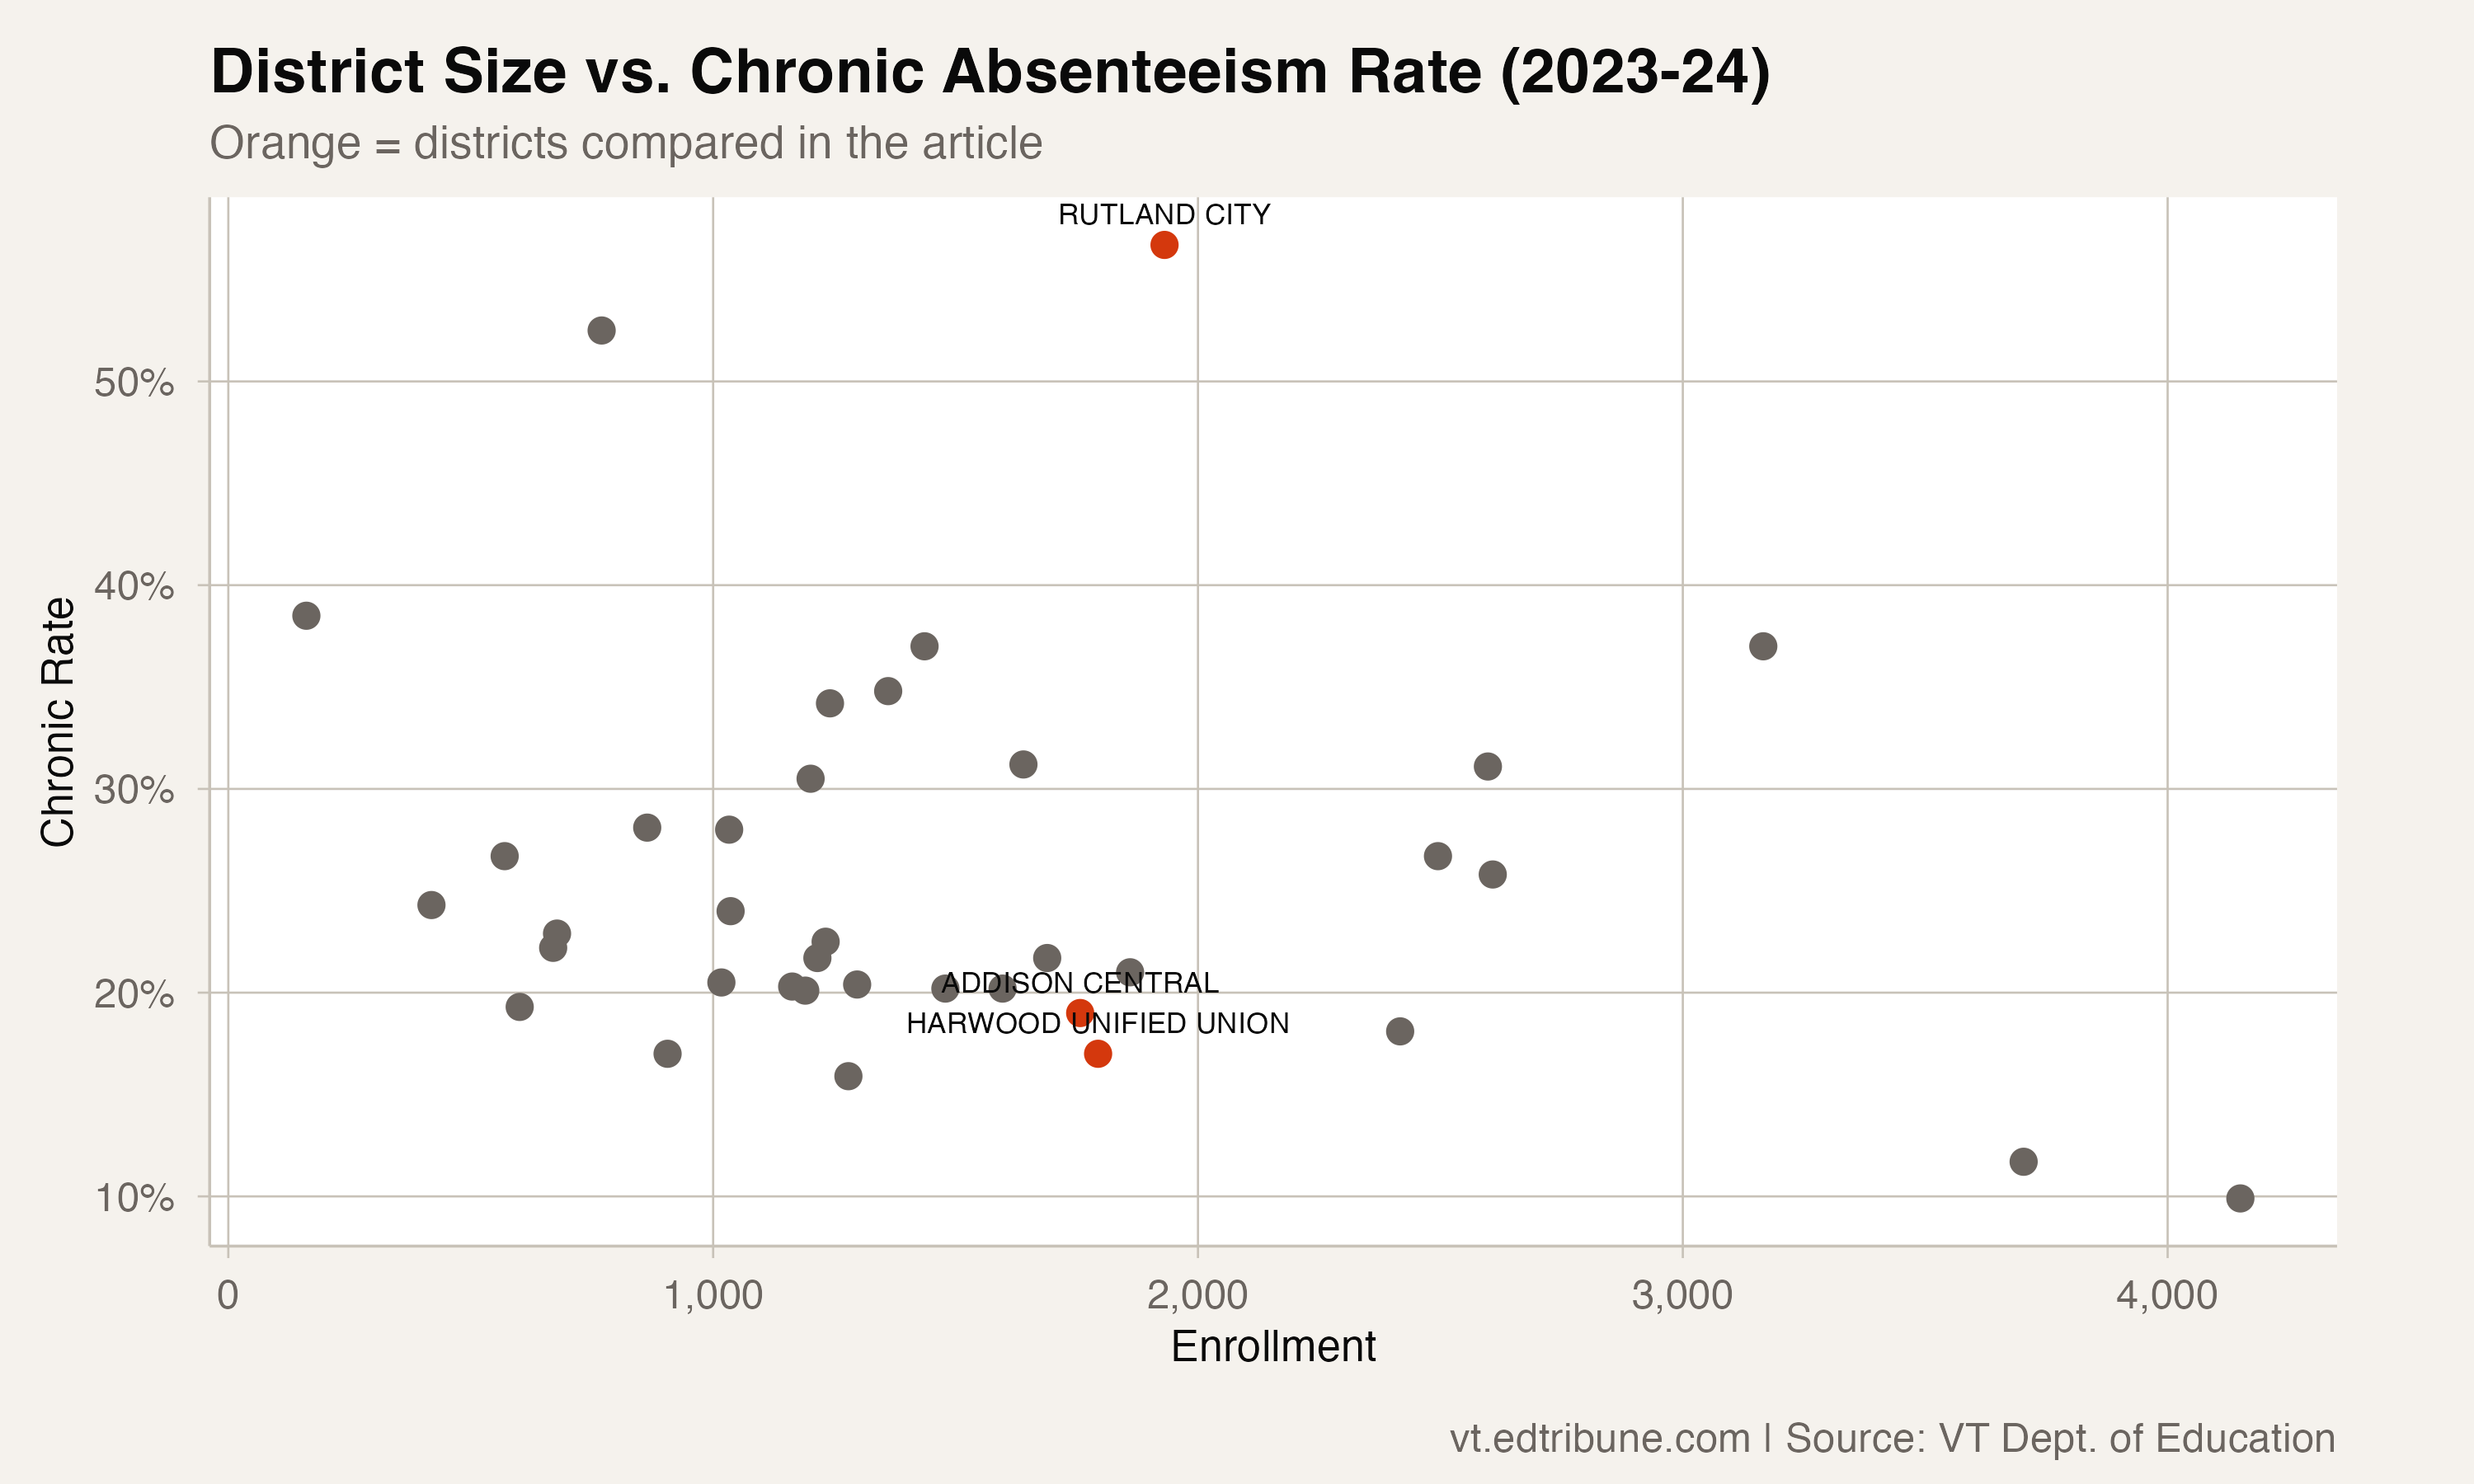
Vermont's chronic absenteeism data shows almost no correlation between district size and chronic rate. The largest districts have some of the lowest rates (Champlain Valley↗ET at 9.9%, Essex Westford↗ET at 11.7%) and the highest rates belong to mid-sized districts. The problem is not scale. Districts with 770 students (Winooski↗ET, 52.5%) and districts with 3,166 students (Southwest Vermont↗ET, 37.0%) struggle equally.
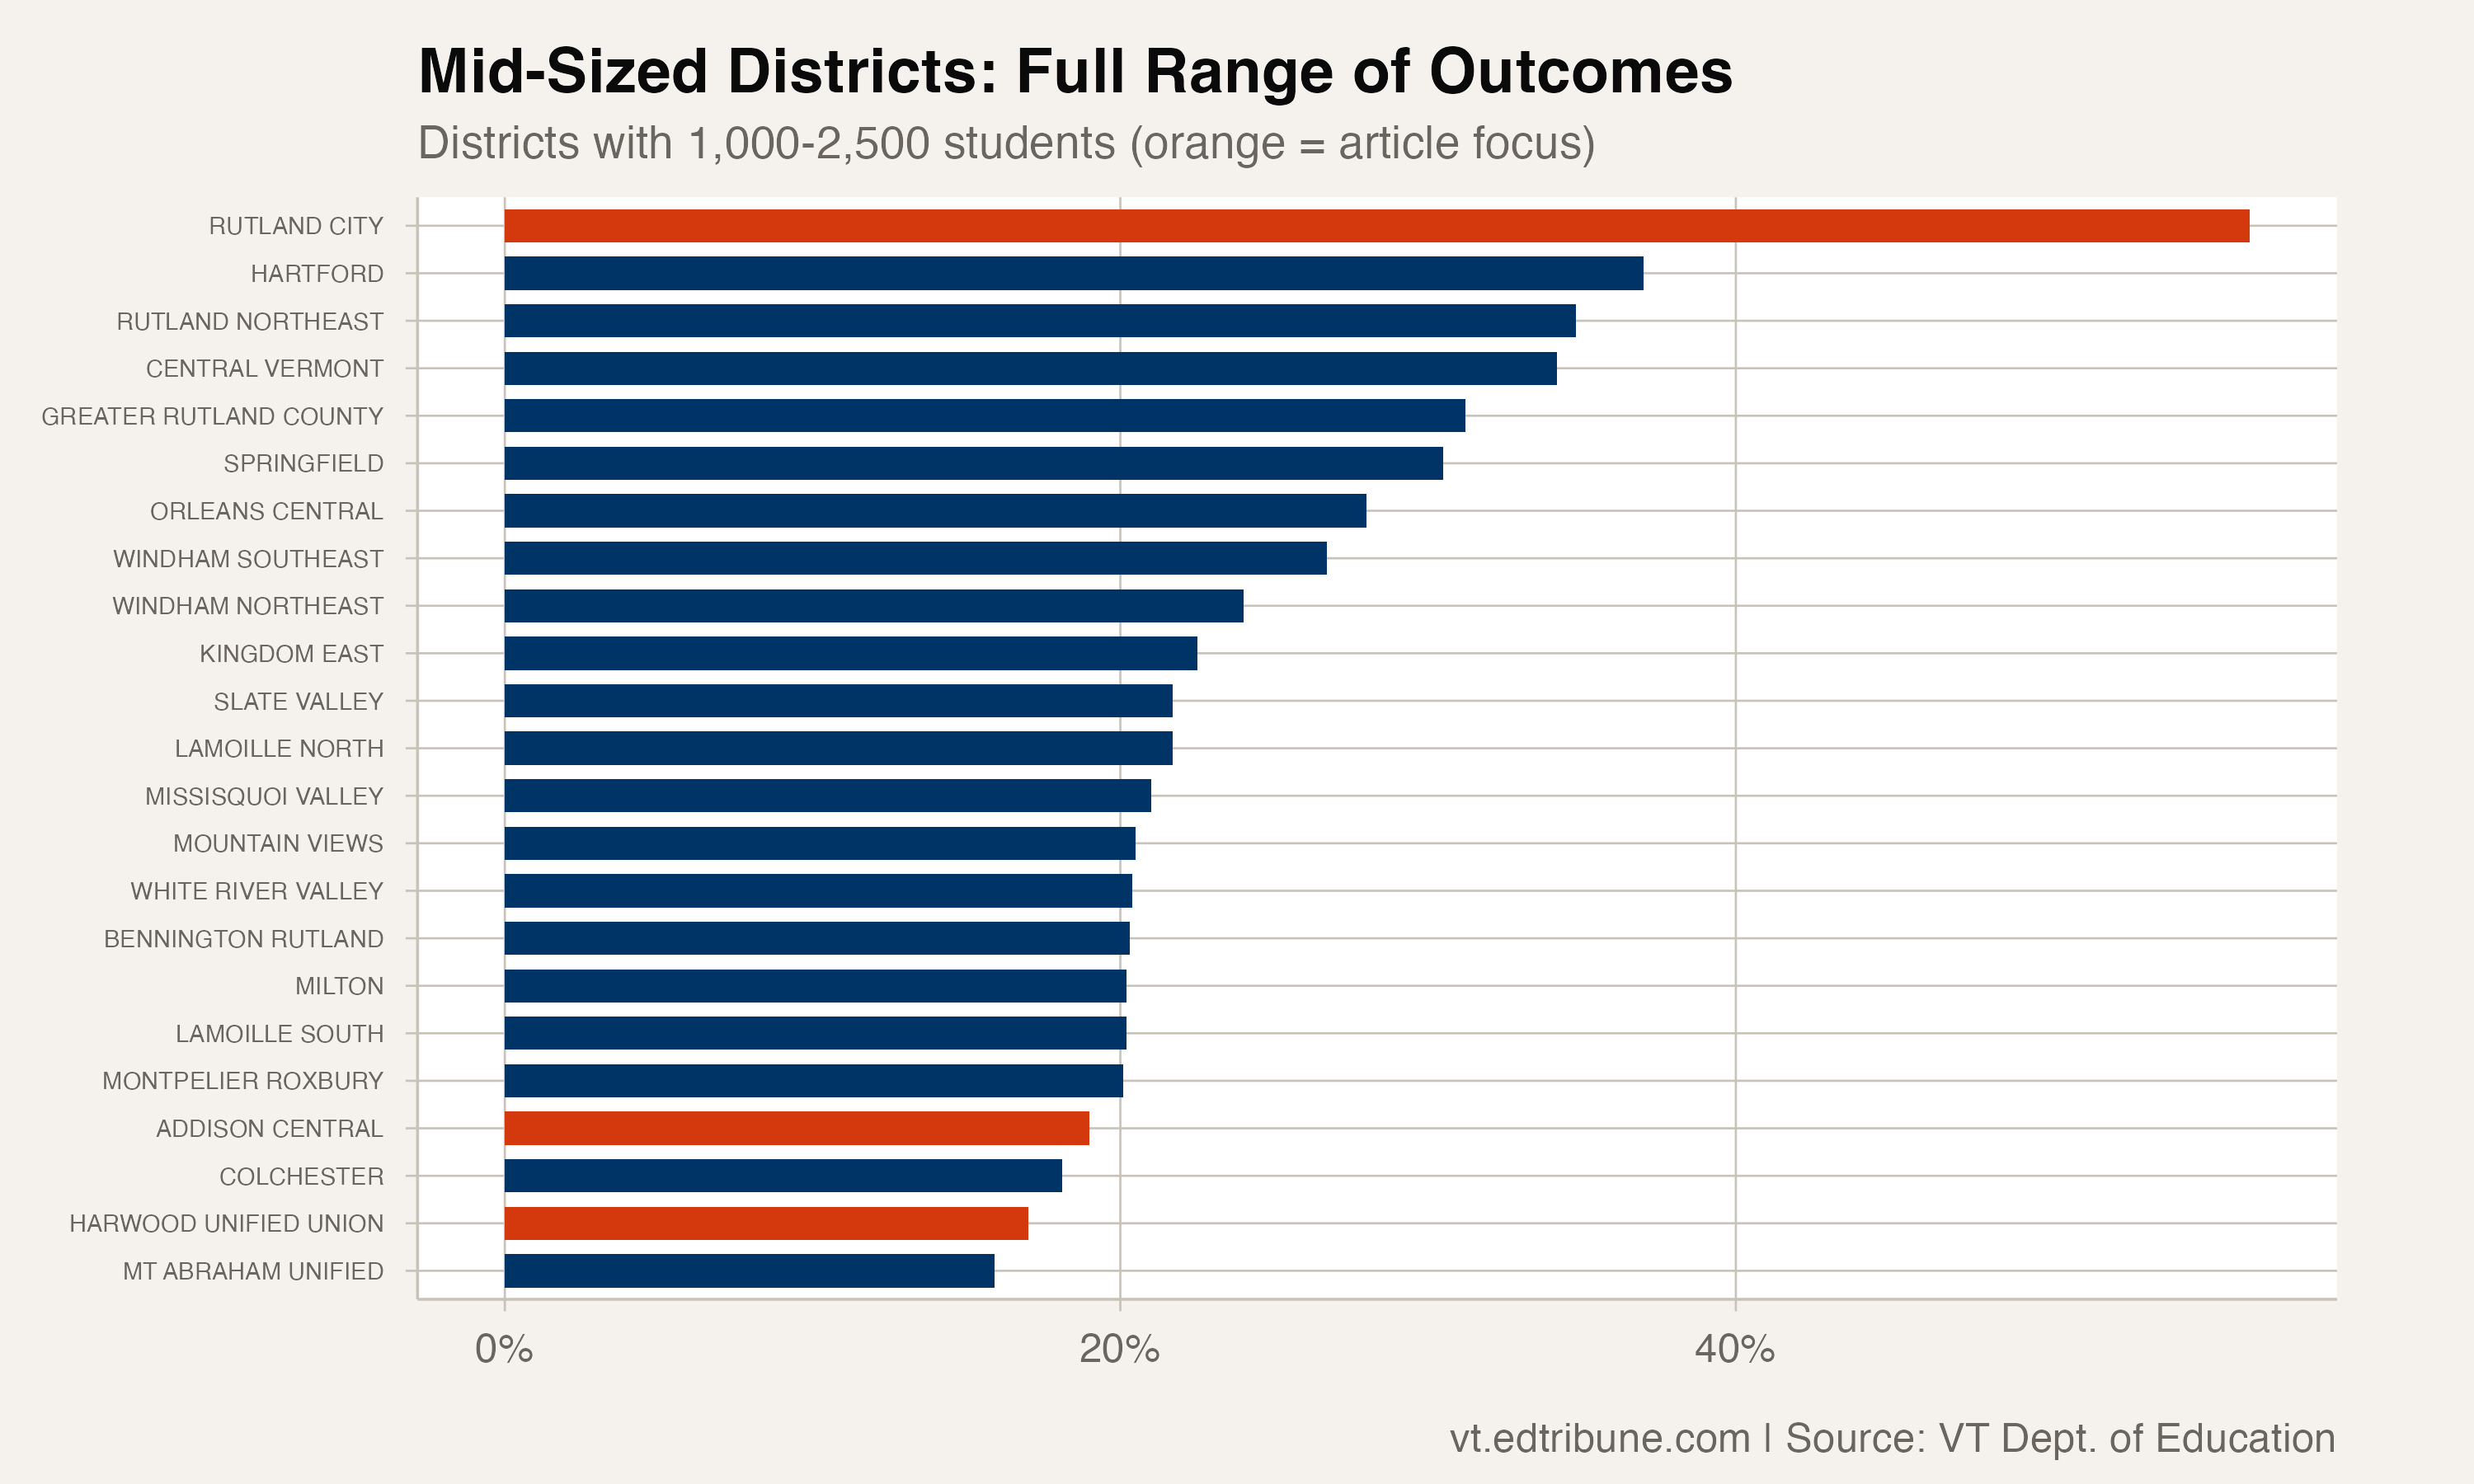
Among mid-sized districts, those with 1,000 to 2,500 students, the range runs from about 16% (Mt Abraham, the lowest) up to Rutland City's 56.7%. Harwood sits near the bottom of that range at 17.0%. No variable visible in the data fully accounts for the spread.
What the gap reflects
The most likely drivers are the ones the state's chronic absenteeism data does not measure directly: poverty rates, housing instability, access to healthcare, substance use in the community, and the availability of adults who can ensure a child gets to school each morning.
Rutland has struggled with opioid addiction at rates that exceed most of Vermont. The region's economy has contracted as marble quarries and rail operations declined. Housing costs have risen while wages have not kept pace. These are conditions that make school attendance harder, not because families do not value education, but because the logistics of daily life are more precarious.
Harwood, by contrast, sits in the Mad River Valley, a tourist economy with ski resorts, small farms, and a population that skews toward outdoor recreation. The community is not wealthy in Vermont terms, but it has different economic dynamics. More two-parent households. More access to transportation. Different public health challenges.
Why it matters
A 40-point gap between equally-sized districts in a state of 80,000 students undercuts any statewide intervention strategy. A policy designed to reduce chronic absenteeism from 24% to 15% may work in Harwood, where the remaining challenge is nudging an already-reasonable rate lower. It is unlikely to have the same effect in Rutland City, where the majority of students are chronically absent and the root causes extend far beyond school walls.
Vermont's advantage has always been its smallness: districts where superintendents know families, where school communities are tight-knit. The 40-point gap suggests that this advantage has limits. Knowing the families does not solve transportation barriers. Tight-knit communities do not overcome generational poverty. The data does not tell Vermont how to close the gap. It tells Vermont the gap exists, which is the prerequisite for any honest conversation about what it would take.
Detailed code that reproduces the analysis and figures in this article is available exclusively to EdTribune subscribers.
Discussion
Sign in to join the discussion.
Loading comments...