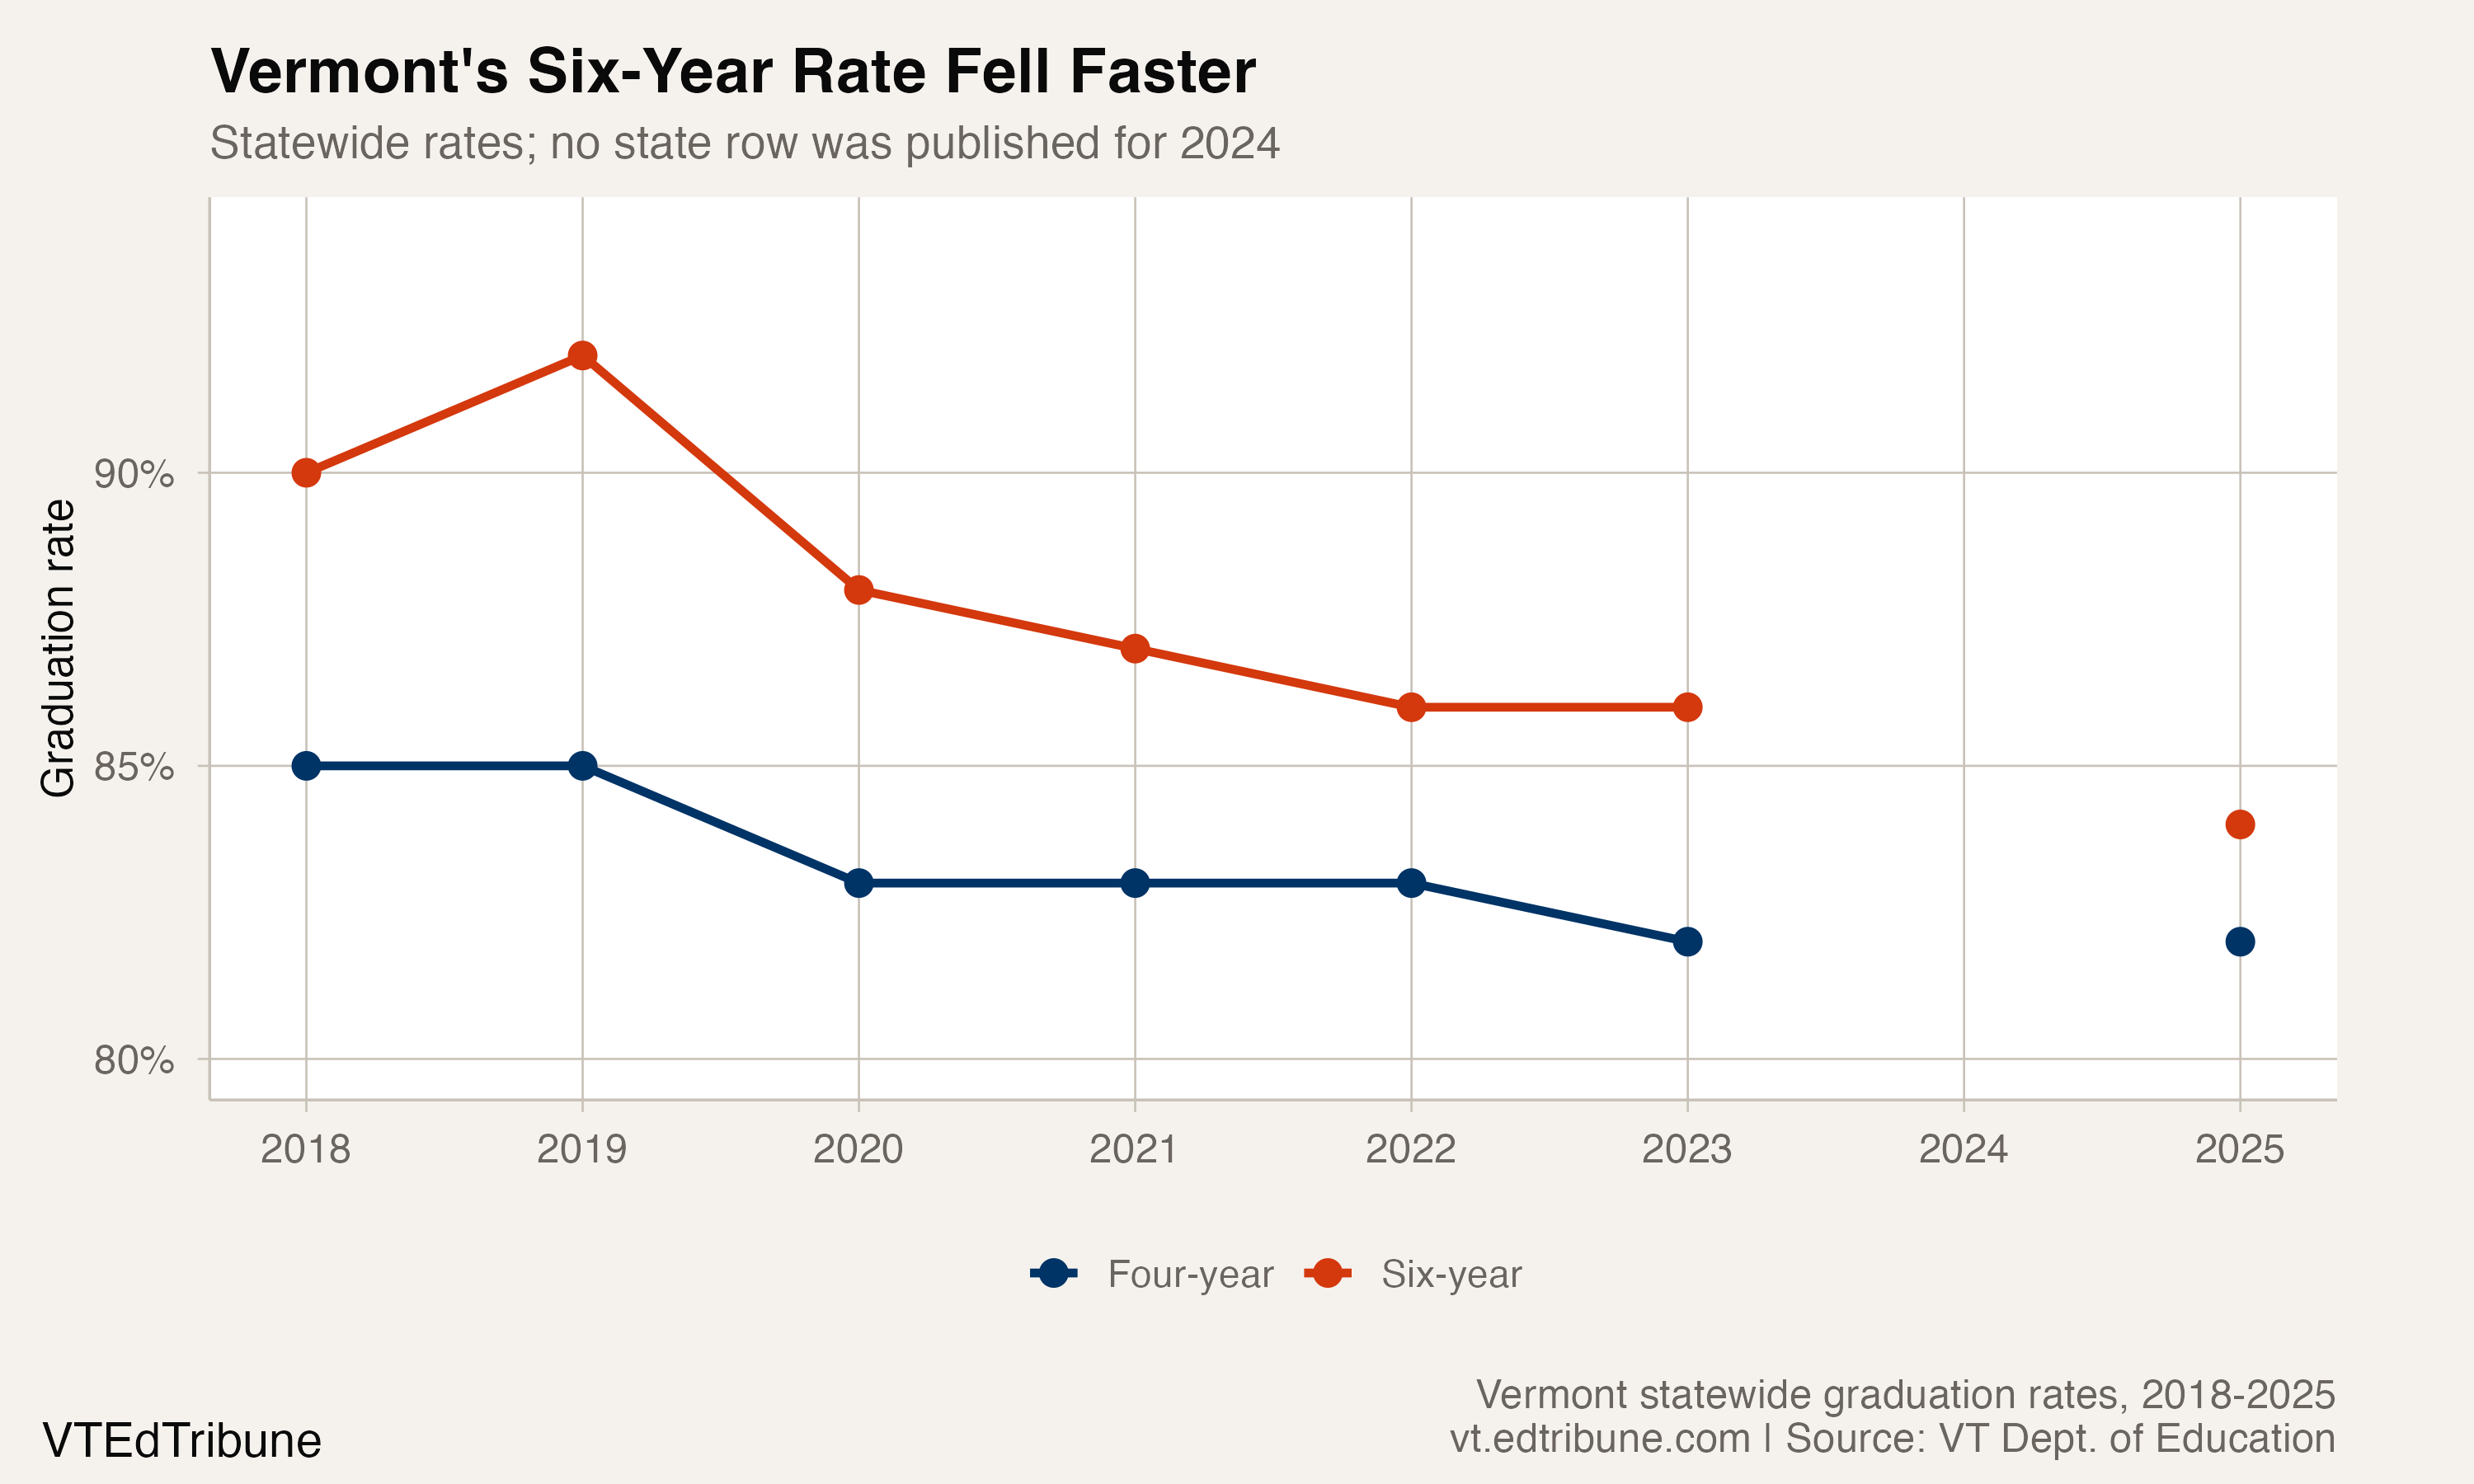
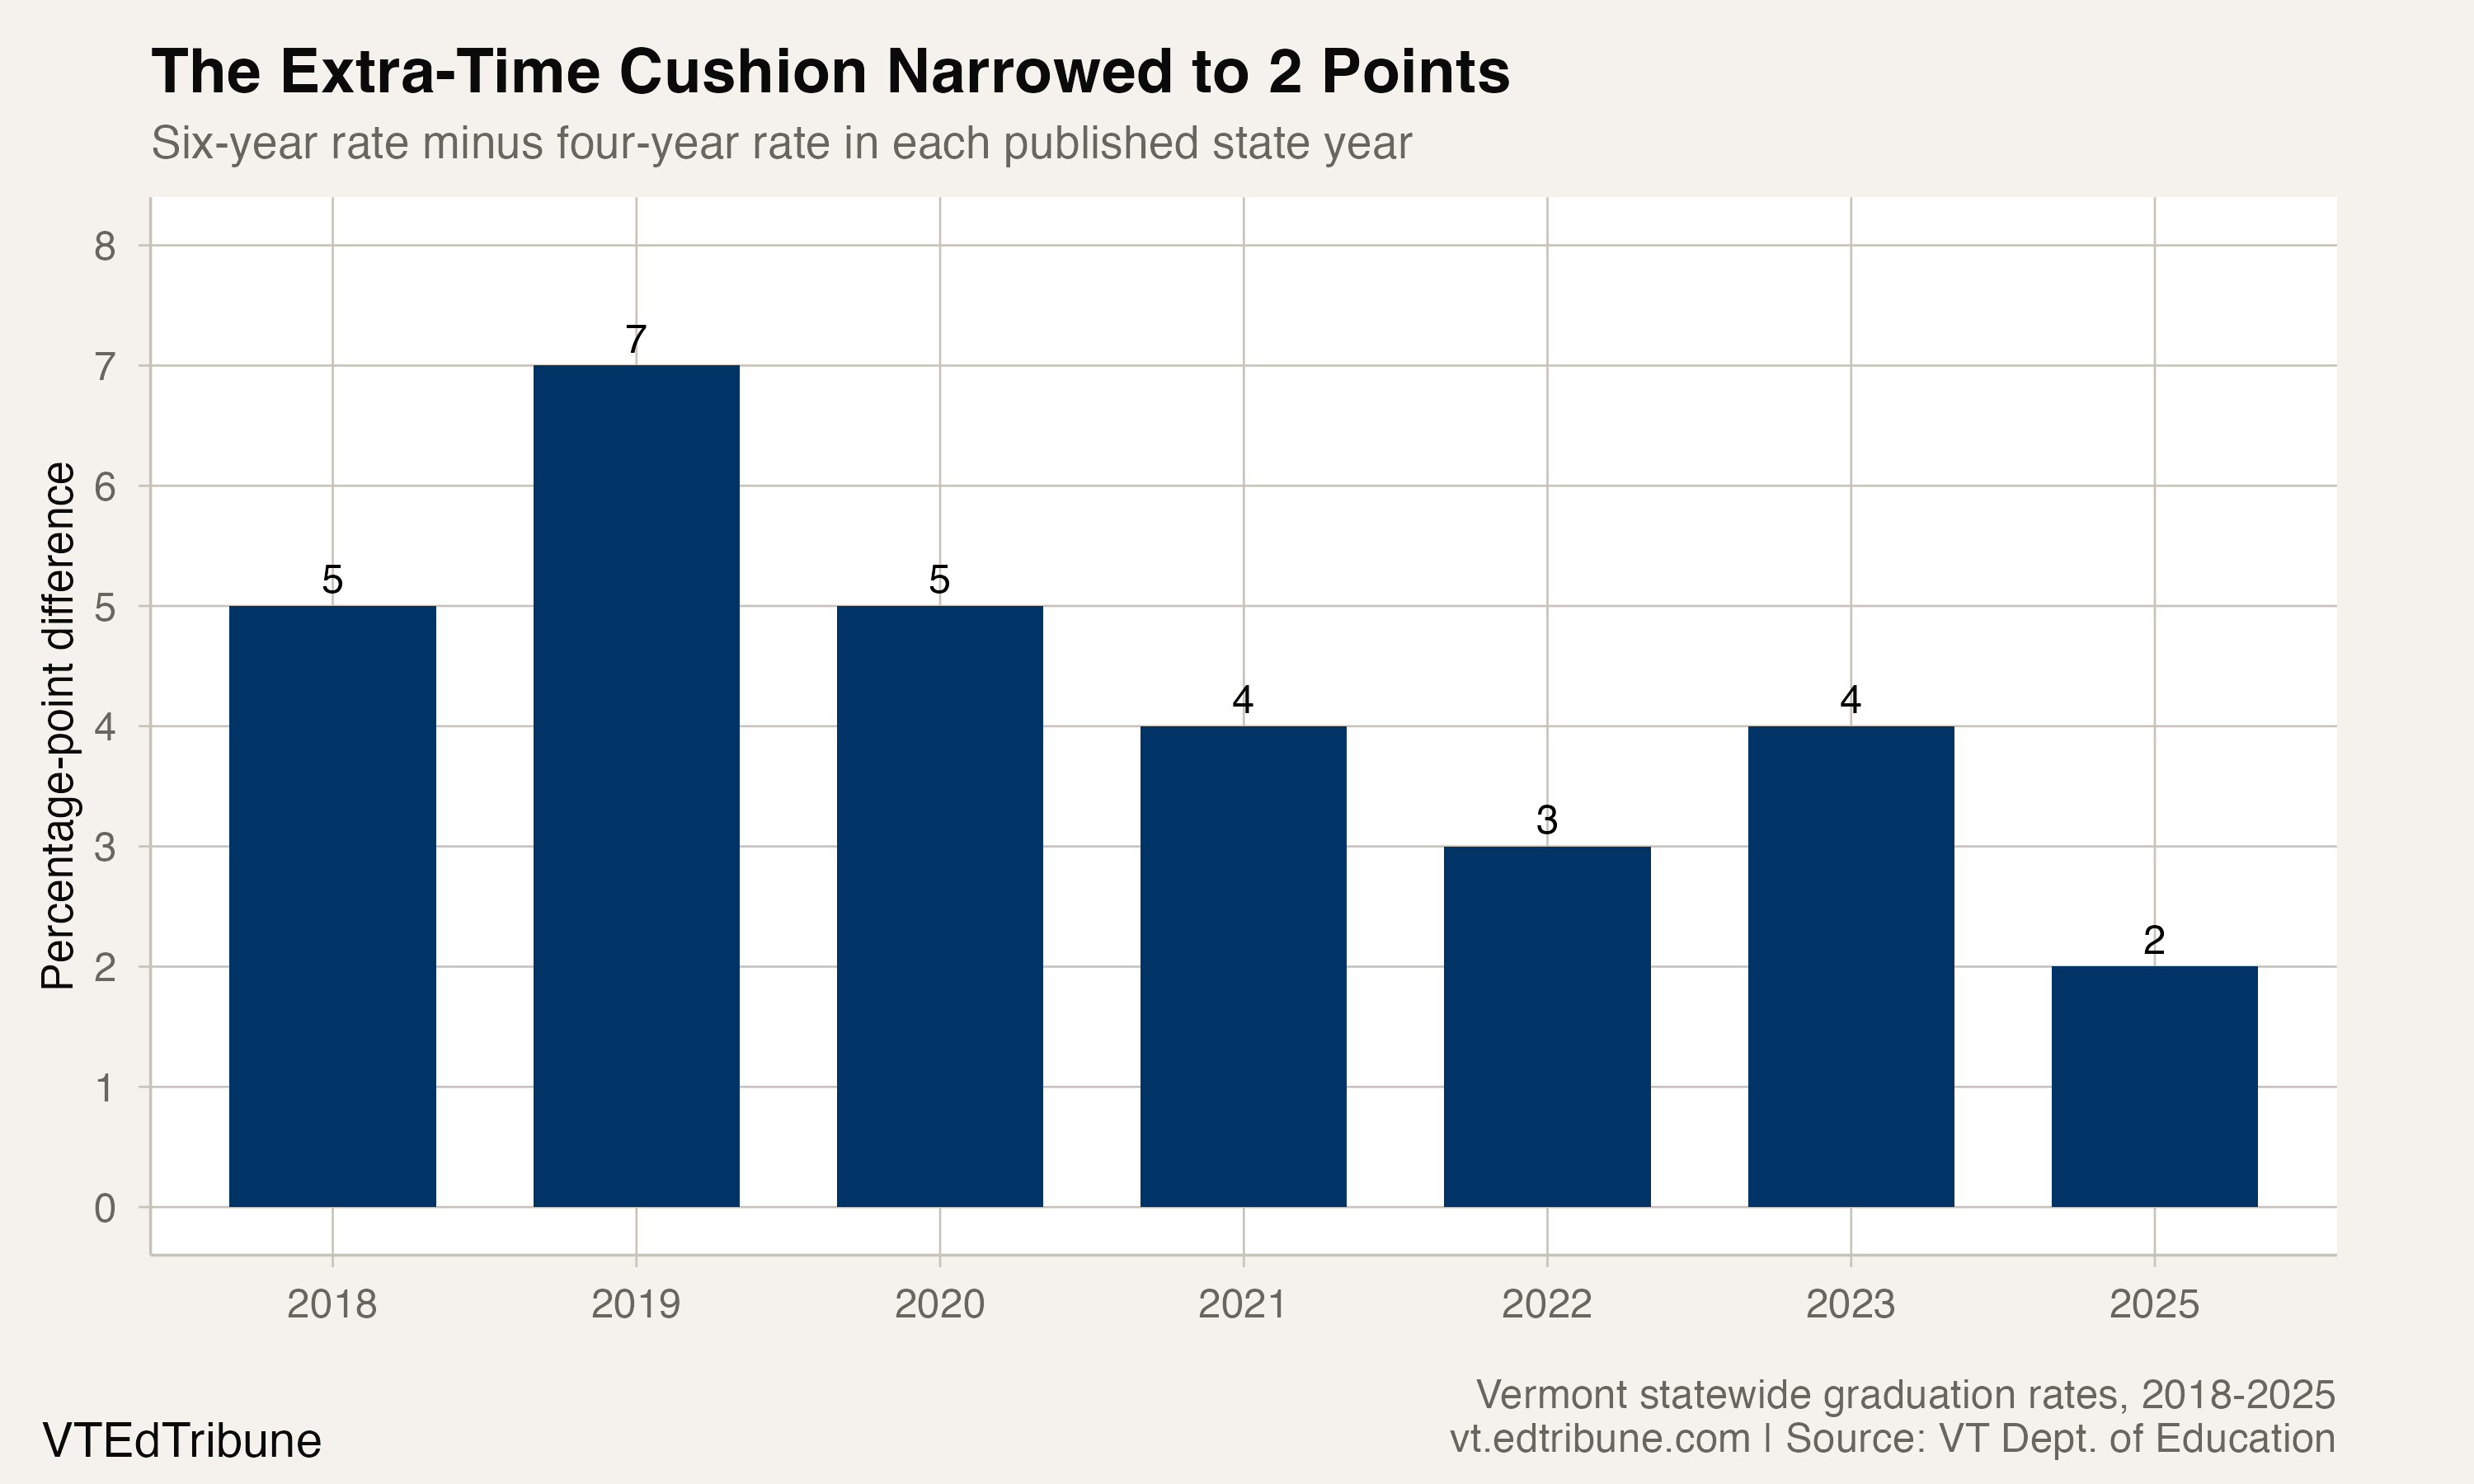
Vermont's six-year graduation rate once added substantially to the share of students counted as graduates. In 2019, the state's rate rose from 85% at four years to 92% at six, a 7-point difference.
By 2025, the published rates were 82% and 84%. The extra-time difference had narrowed to 2 points, the smallest in Vermont's seven available statewide reporting years.
The extended-time measure fell faster
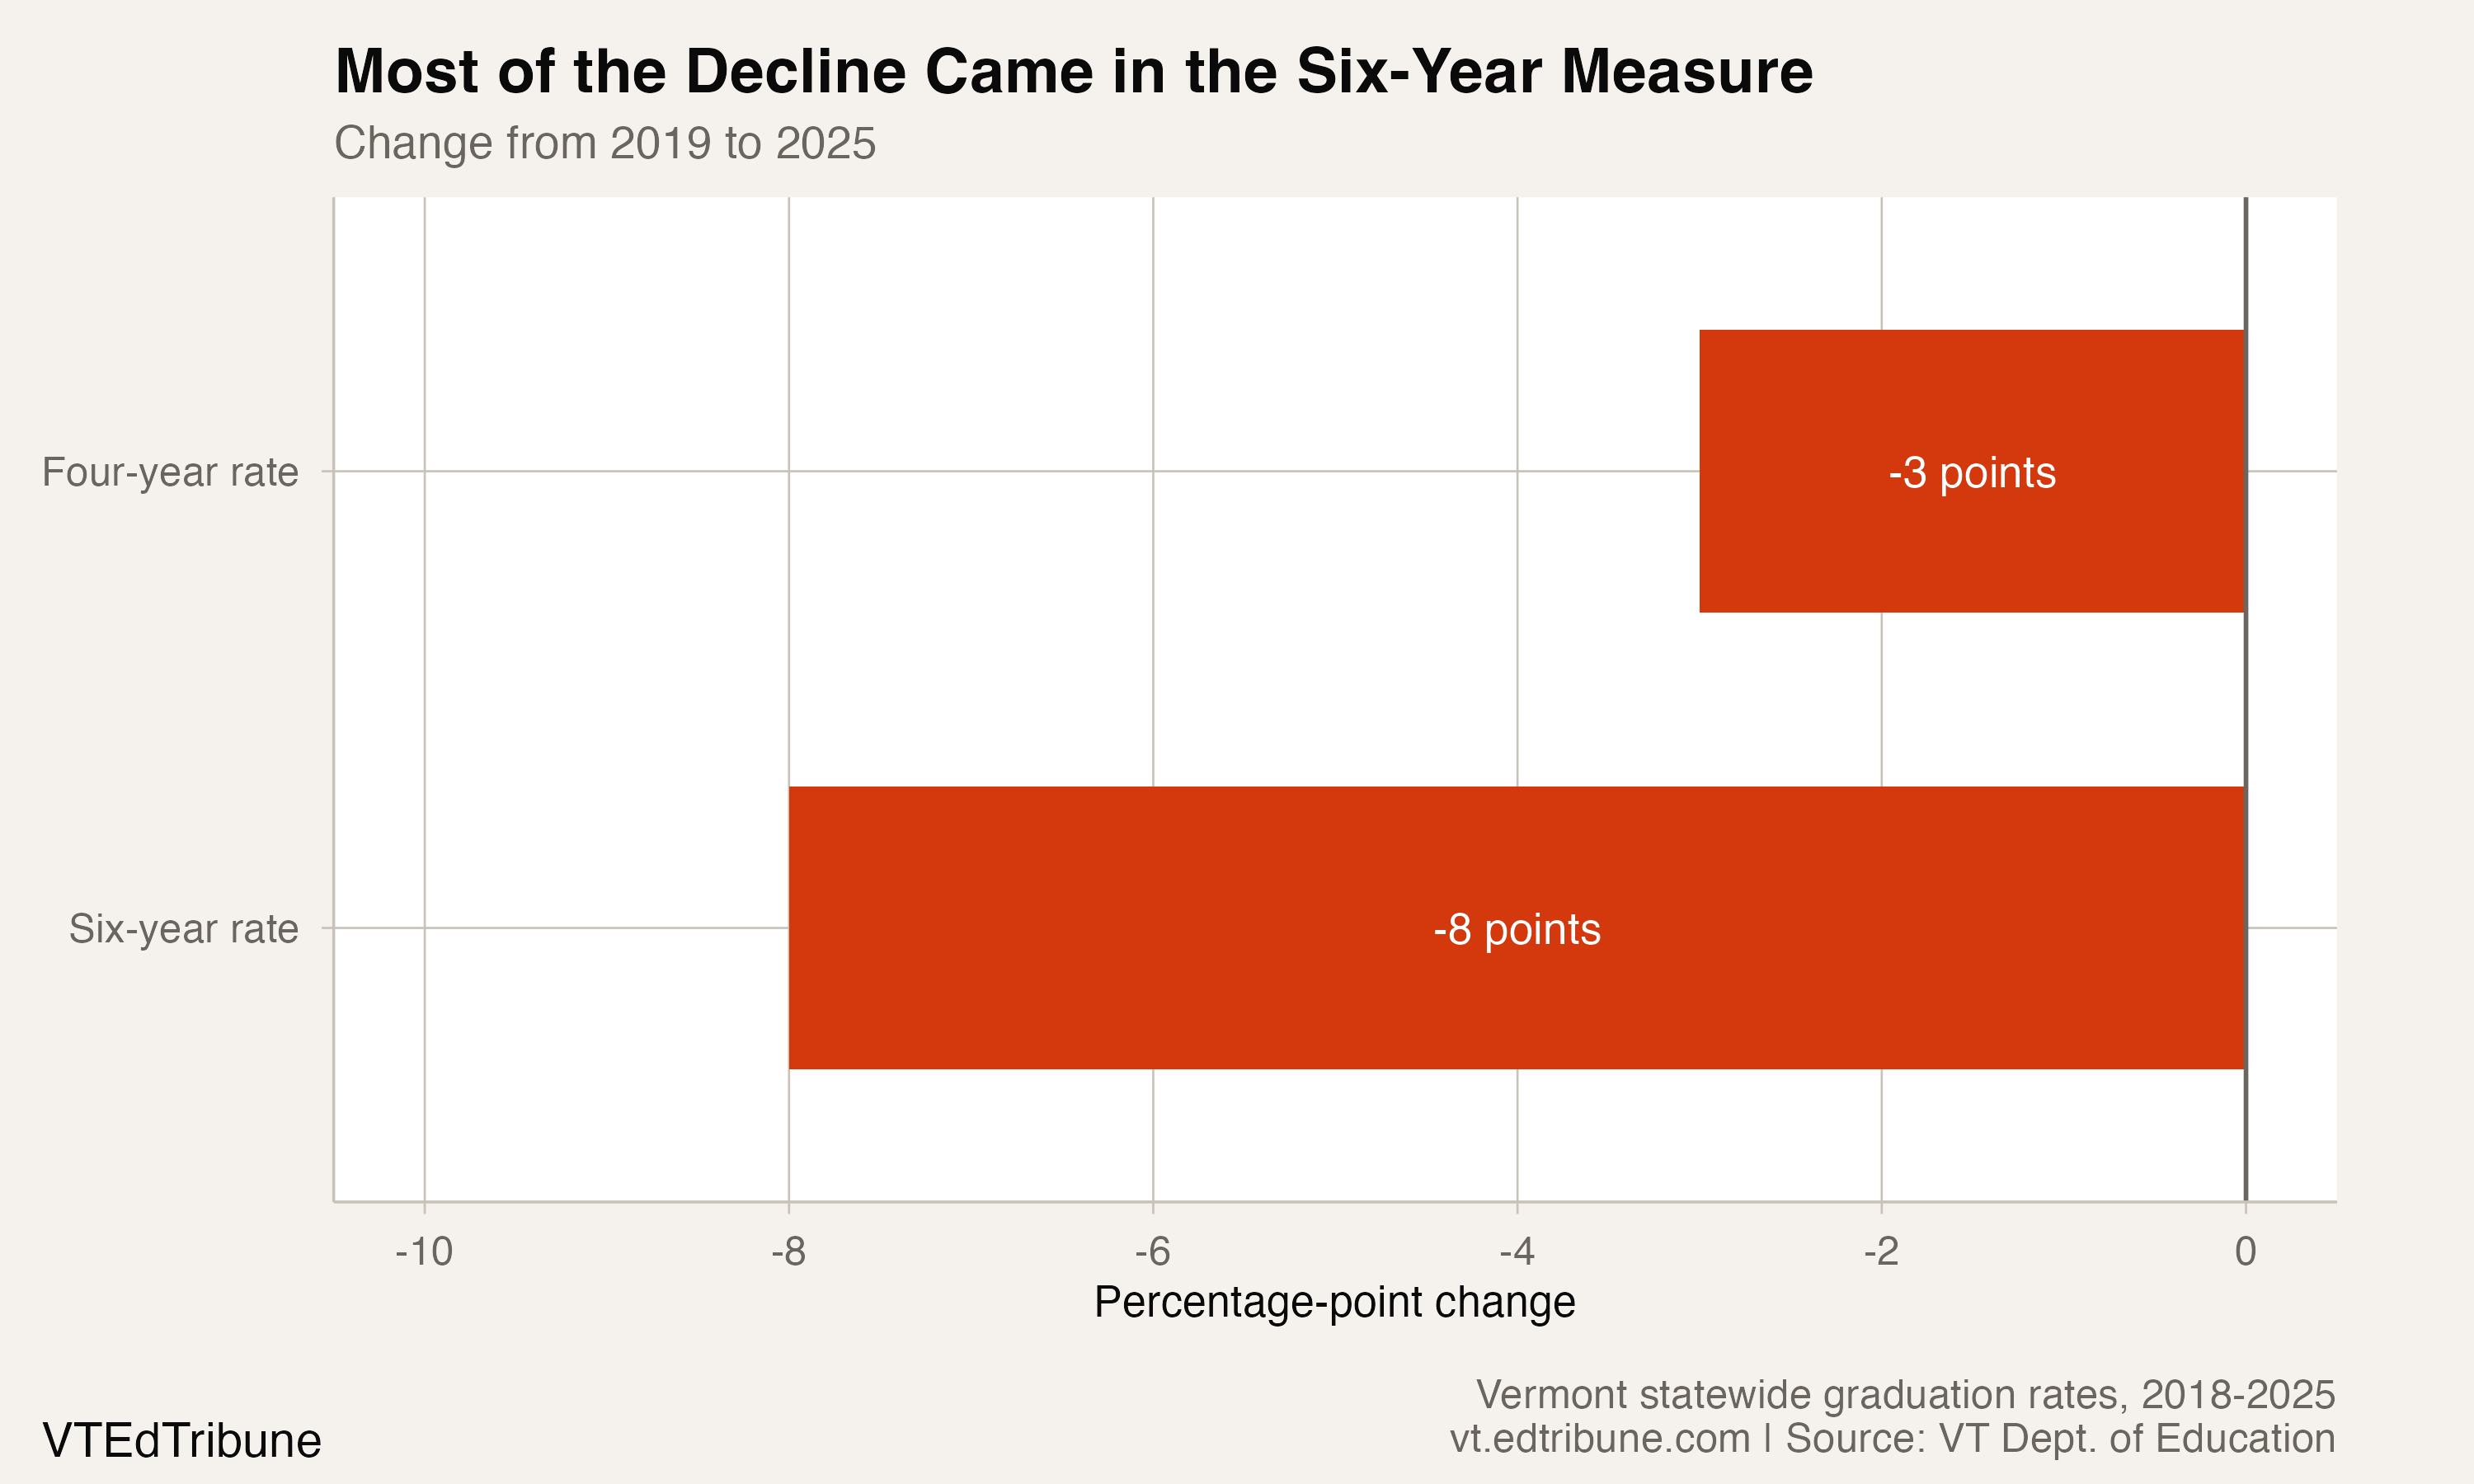
The four-year rate declined 3 points from 2019 to 2025. The six-year rate declined 8 points over the same endpoints. That uneven movement produced the 5-point contraction in the gap between them.
The pattern does not depend entirely on selecting the 2019 peak. The extra-time difference was 5 points in 2018 and 2020, 4 points in 2023 and 2 points in 2025. Each of those available comparisons points to a smaller latest-year cushion.
Vermont did not publish a statewide row for 2024 in this series. The chart therefore compares seven published state reporting years from 2018 through 2025; it does not claim an unbroken annual decline.
What the gap can and cannot show
The gap is a descriptive measure. It shows how much higher the published six-year rate was than the four-year rate for each reporting year. It does not follow one identical set of students from one measure to the other.
The aggregate file also cannot identify why the difference narrowed. A change in delayed diploma completion is one possibility. Changes in cohort composition or reporting could also affect the result. The data do not isolate a program, policy or school practice as the cause.
That limitation is especially important in 2025, when subgroup results show that the value of extra time varied widely. The all-student gain was 2 points, but some groups had much larger differences between their published four- and six-year rates.
A statewide decline concentrated after year four
Comparing the same endpoints clarifies the scale. The on-time measure moved from 85% to 82%. The extended measure moved from 92% to 84%.
Vermont's four-year rate has been between 82% and 83% in every published year since 2020. The six-year rate, by contrast, moved from 88% in 2020 to 84% in 2025. The state's latest results leave less separation between on-time completion and the longer window than any other year in the available state panel.
Data source: Vermont Agency of Education adjusted cohort graduation data for seven published statewide reporting years. The agency provides access instructions for its Vermont Education Dashboard and Annual Snapshot files.
Detailed code that reproduces the analysis and figures in this article is available exclusively to EdTribune subscribers.
Discussion
Sign in to join the discussion.
Loading comments...