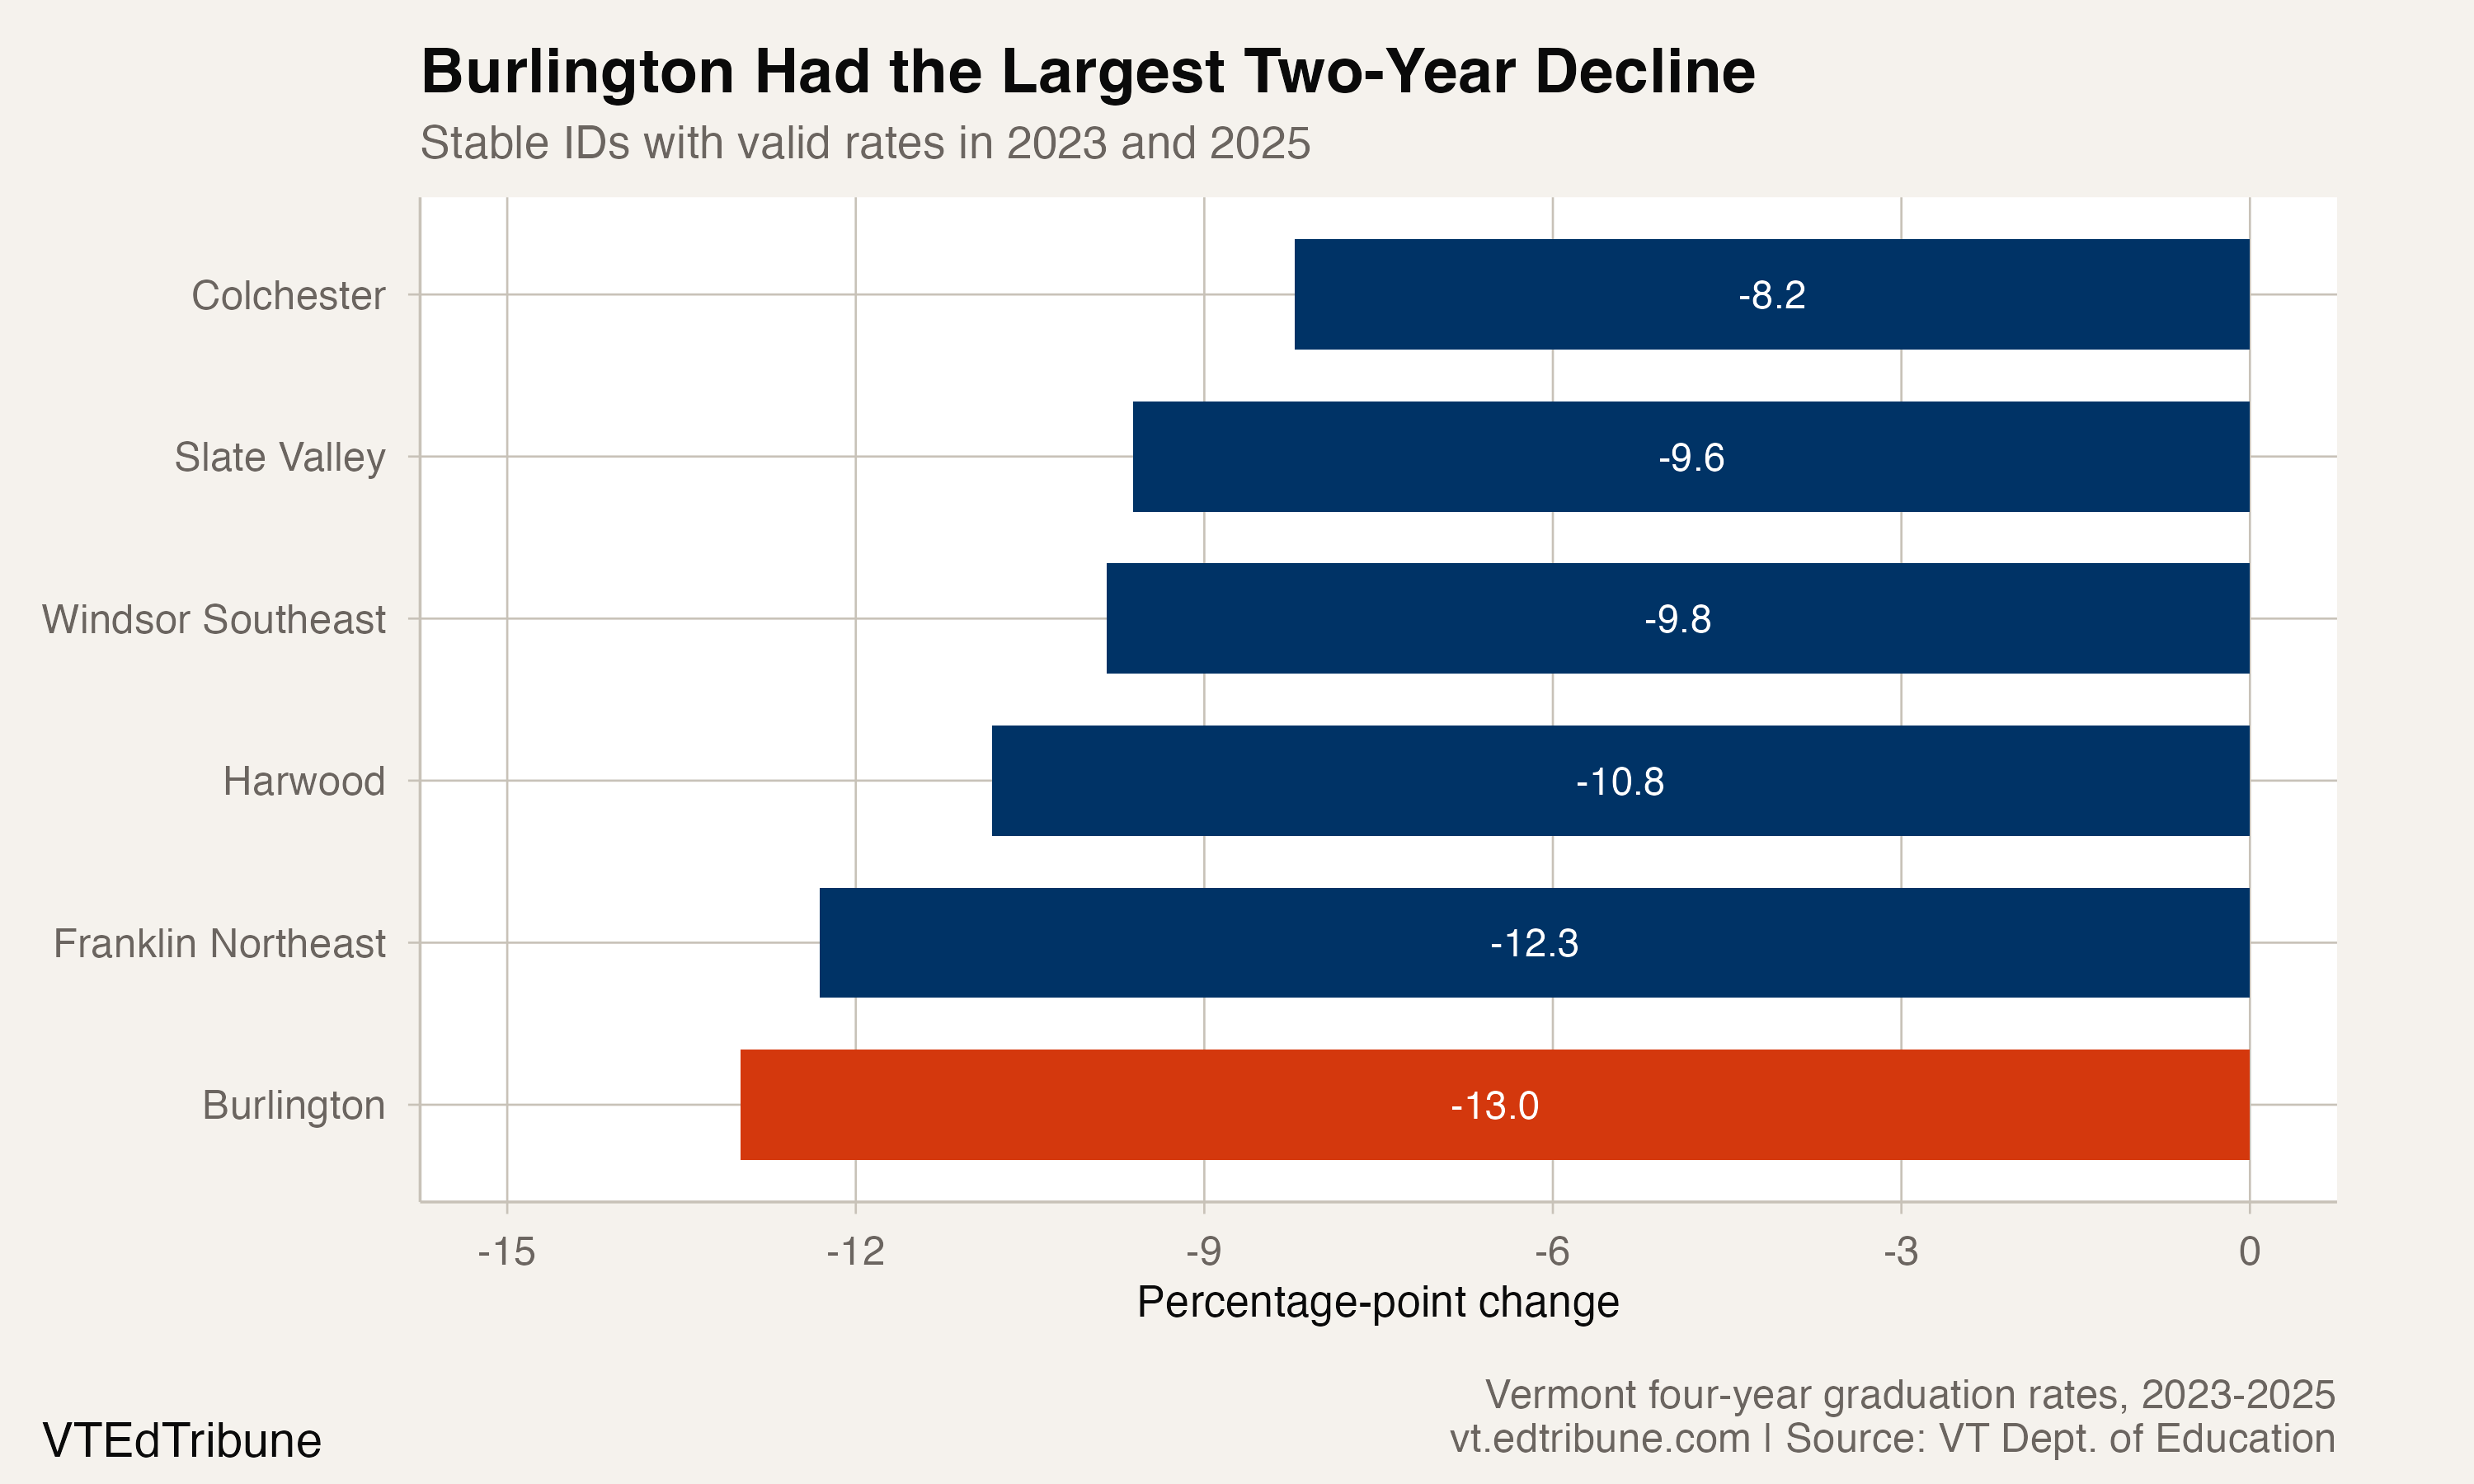
Burlington SD↗ET's four-year graduation rate fell from 84.2% in 2023 to 71.2% in 2025. The 13.0-point decline was the largest among 43 Vermont supervisory unions and districts with valid rates at both endpoints.
The change unfolded in two steps. Burlington's rate moved to 75.0% in 2024, then declined another 3.8 points in 2025. The statewide rate was 82% at both available endpoints.
A local reversal against a flat state benchmark
Burlington started 2023 at 2.2 points above Vermont. It finished 2025 at 10.8 points below the state, a 13.0-point swing in its position relative to the statewide rate.
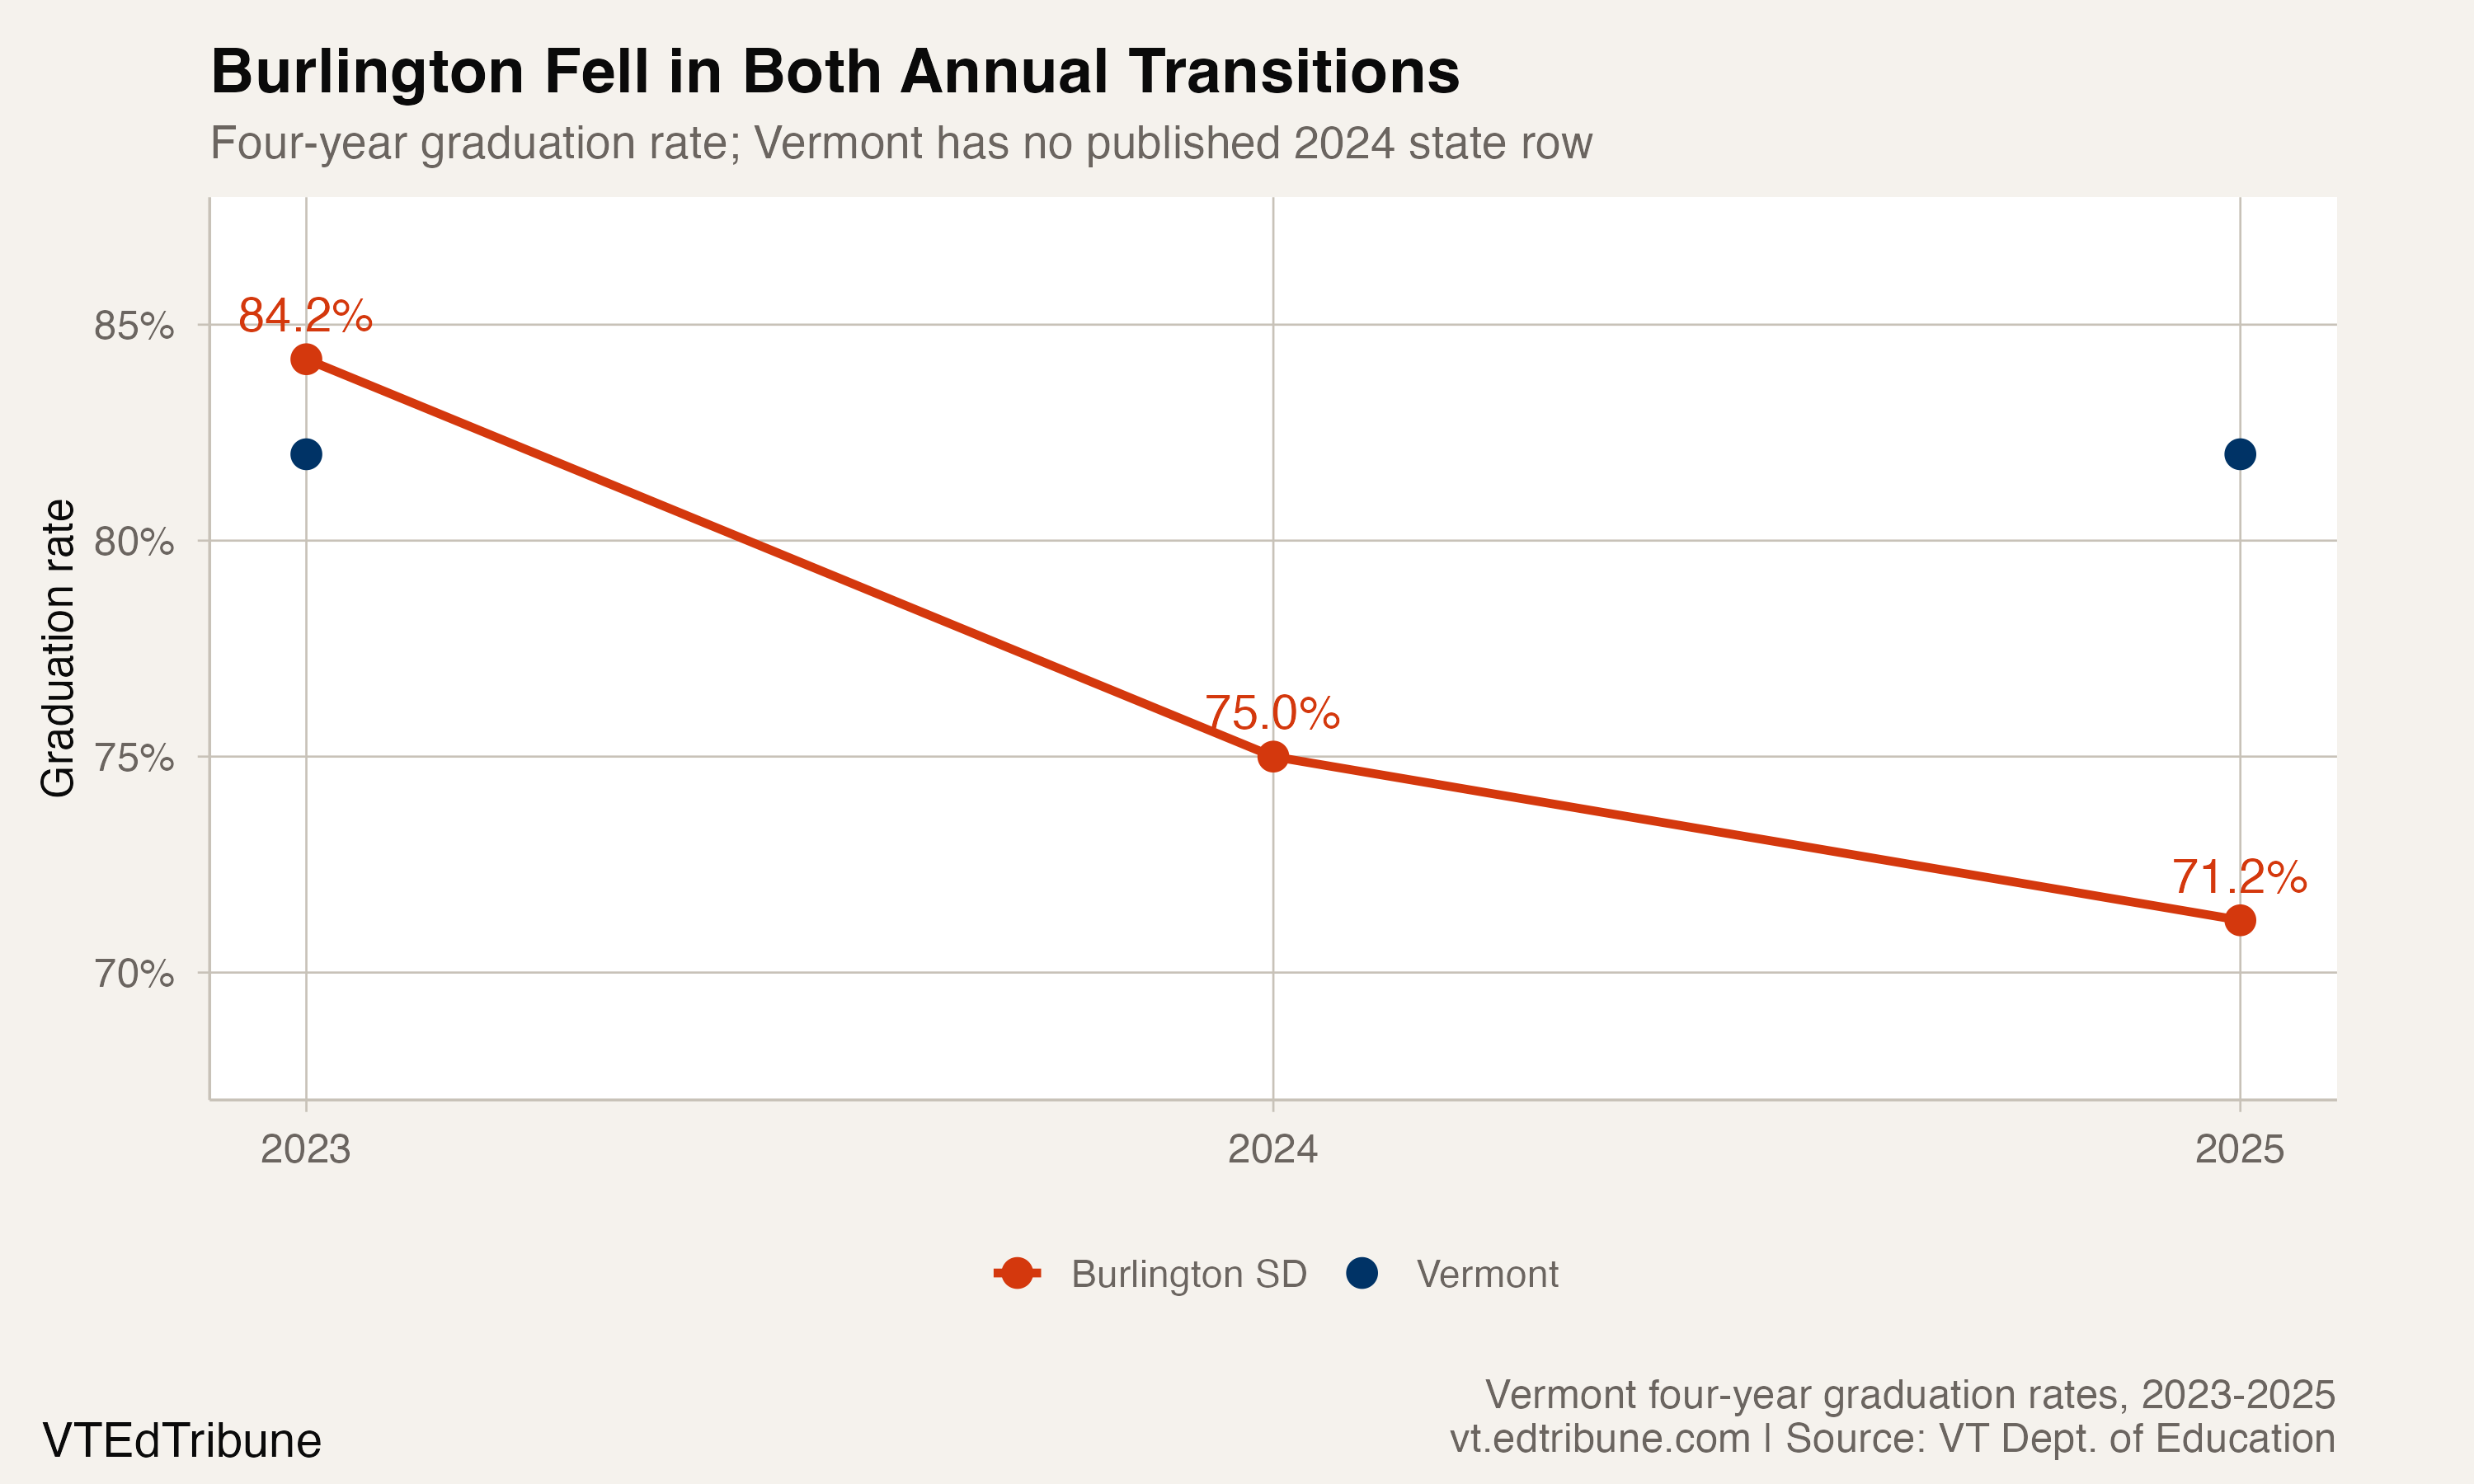
Vermont has no published 2024 state row in this series, so the statewide comparison uses 2023 and 2025. Burlington has local rates for all three years.
The local file also reports Burlington High School at the same rate as the district in each year. That is a structural feature of this record: the district's graduation measure is represented by its reporting high school. It should not be read as two independent results.
The steepest change in a stable comparison set
The comparison universe includes exact district identifiers with valid four-year rates in both 2023 and 2025. It contains 43 supervisory unions and districts.
Franklin Northeast SU↗ET had the next-largest decline, from 83.5% to 71.2%, a 12.3-point change. Harwood's supervisory district fell 10.8 points. Burlington's 13.0-point decline remained the largest without imposing a size cutoff or dropping smaller systems.
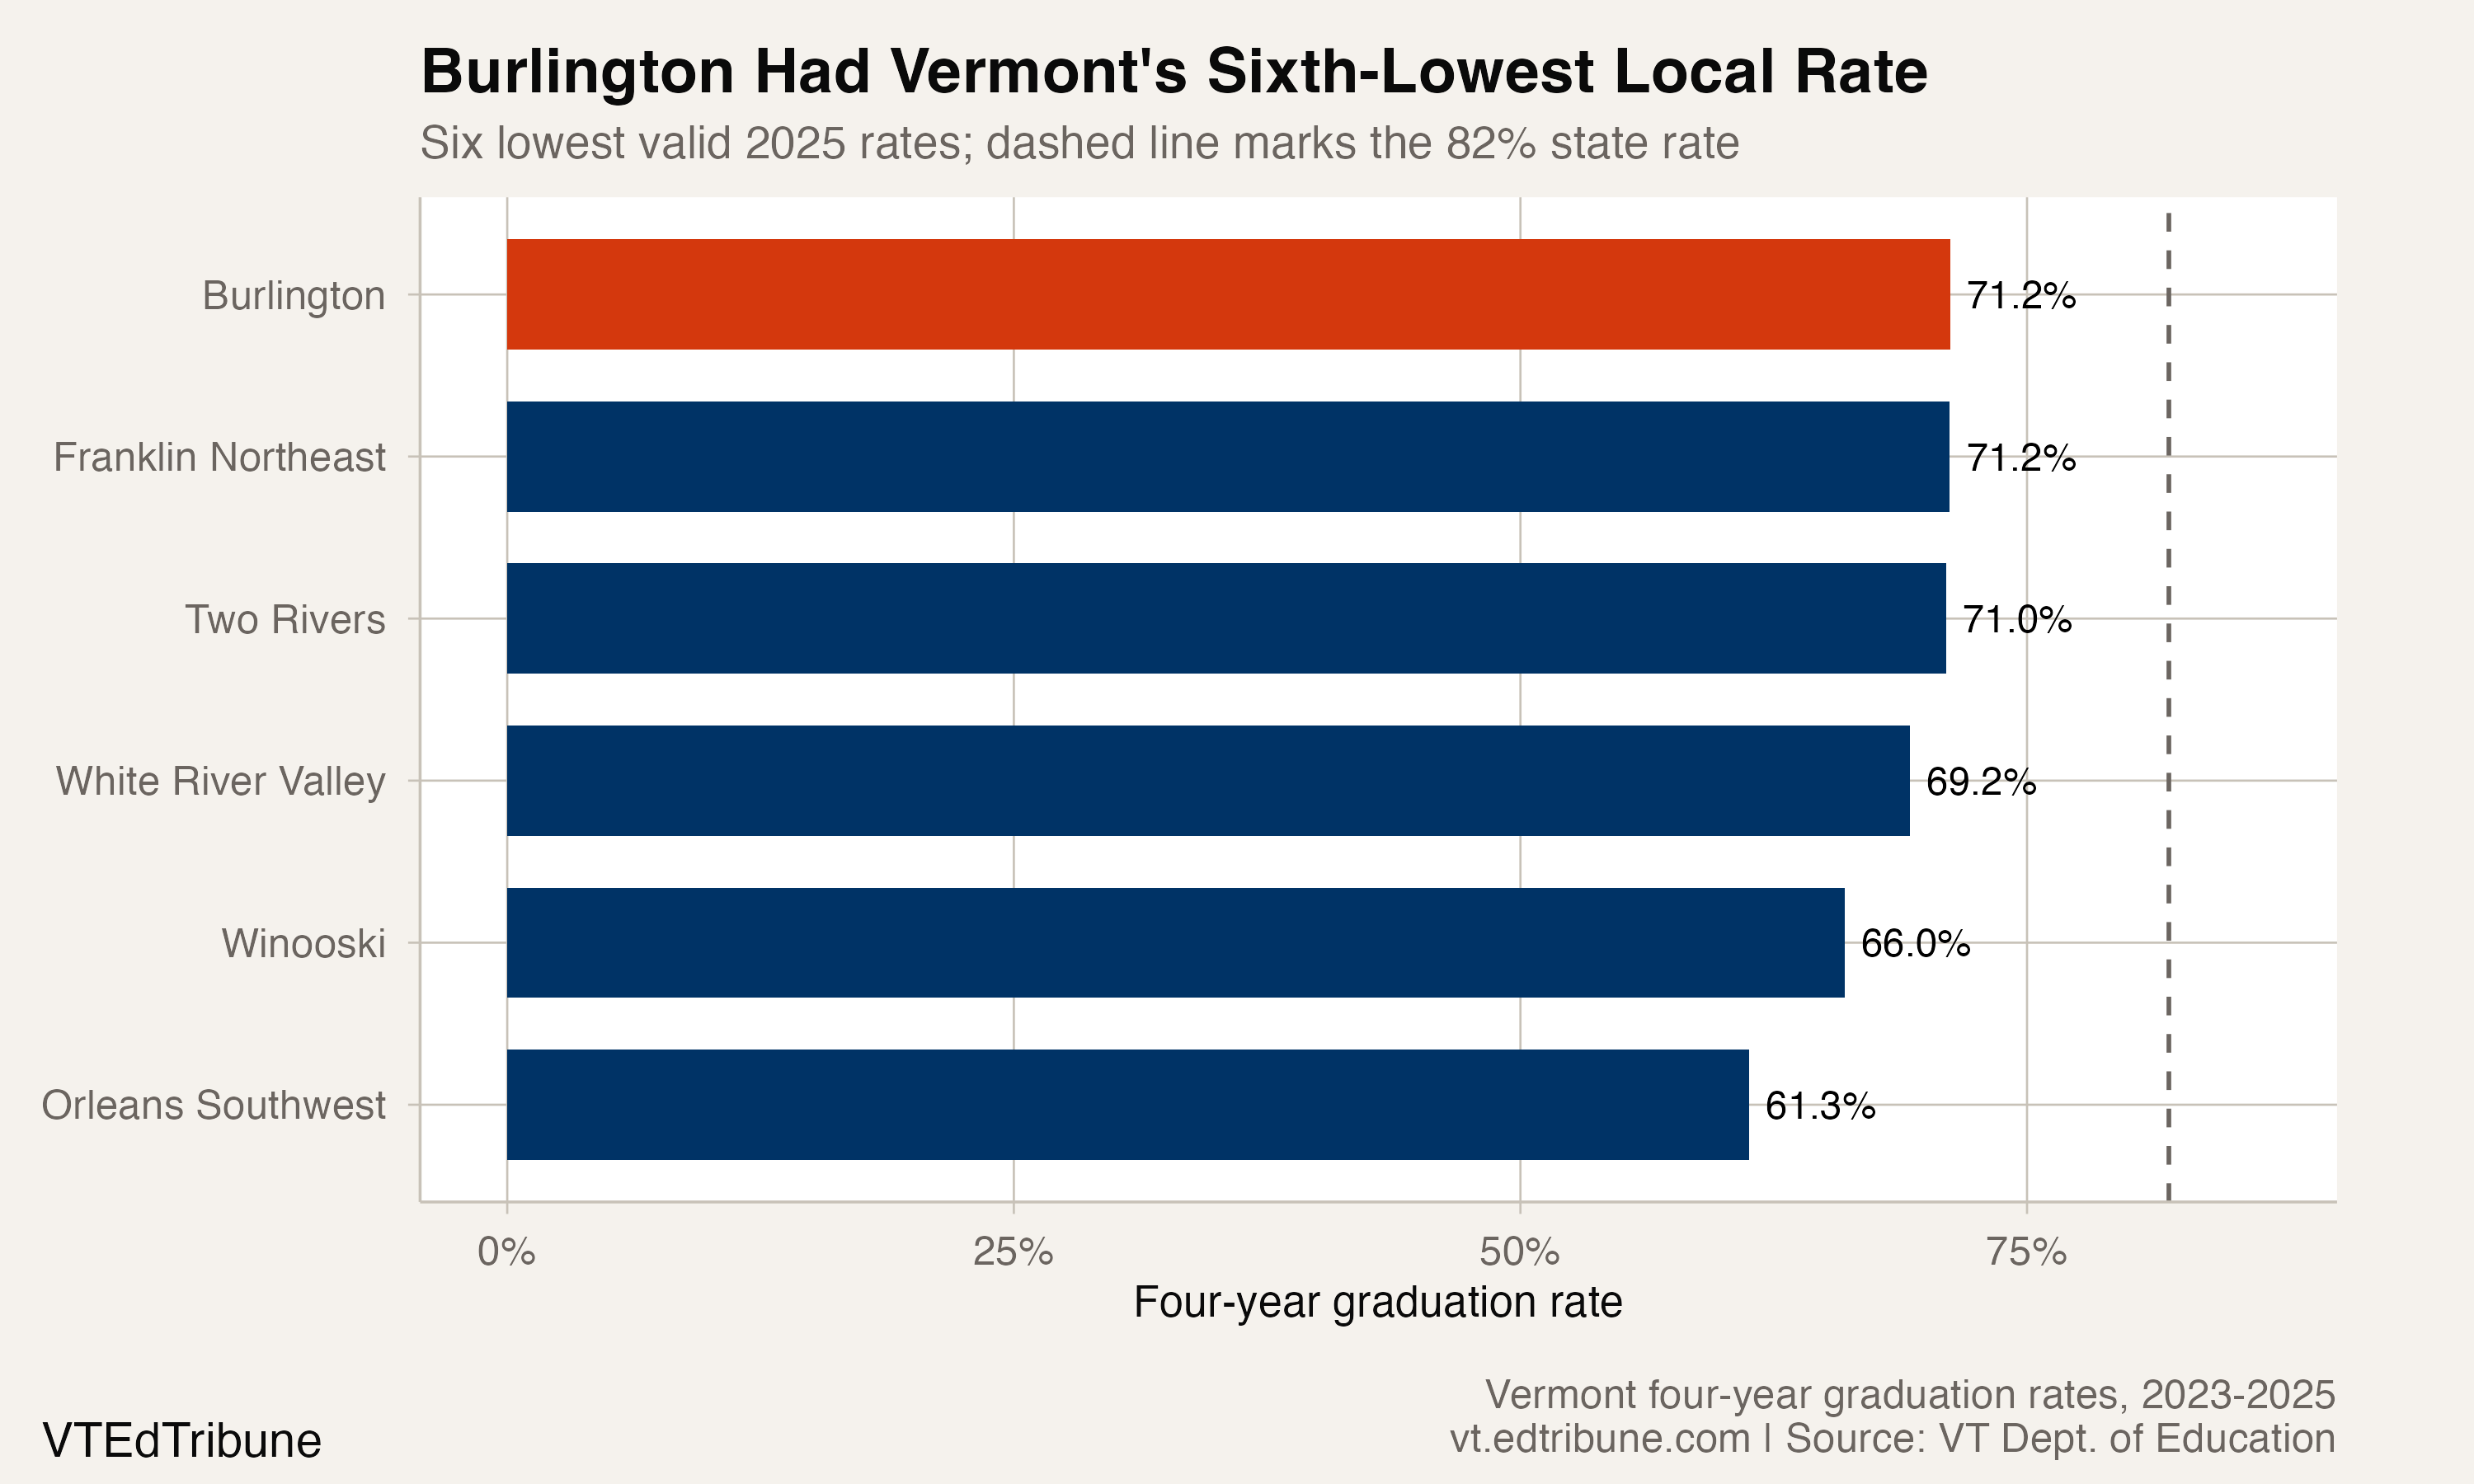
In the full 2025 local file, Burlington had the sixth-lowest valid rate among 44 supervisory unions and districts. Orleans Southwest SU↗ET, Winooski SD↗ET, White River Valley SU↗ET, Two Rivers SU↗ET and Franklin Northeast SU were lower.
The data locates the change, not its cause
Local cohort counts are not available in these package rows. Without them, the public aggregate cannot show how many individual outcomes produced the rate change or how sensitive each year's percentage was to cohort size.
The file also does not identify course completion, transfers, attendance, student services or other possible mechanisms. Each could be investigated with different evidence. None can be inferred from the graduation rate alone.
The next Burlington cohort will matter for distinguishing a one-period shock from a longer slide. For now, the verified claim is narrower: the district recorded Vermont's largest 2023-to-2025 decline in the stable local panel.
Data source: Vermont Agency of Education four-year adjusted cohort graduation results for 2023 through 2025. The agency explains access to the official files on its Annual Snapshot data-download page.
Detailed code that reproduces the analysis and figures in this article is available exclusively to EdTribune subscribers.
Discussion
Sign in to join the discussion.
Loading comments...